This week we're pleased to announce integration of training load into the SportTracks.mobi website.
If you're familiar with training load skip ahead to the feature demo.
If you're looking for some backgrounder info on Training Load, check out our first post in this series: Training Load: Science, History and Application
What is training load?
Training load is a complex set of mathematical models that allow us to predict fitness performance based on your workout history.
These models have been developed and validated in the lab over the last 30+ years, going through several refinements. Now that GPS sensors, heart rate monitors and cycling power meters have been put into the hands of amateur athletes, we can bring these predictive models to you. The best part is you don't need to know any of the maths behind the model - we do all the hard work and show the results to you in 3 easily digestible graphs.
We will go into the training load model in greater detail in a future blog post; for now there are a few simple ideas you need to get up to speed. Ready? Let's go.
The four components of training load
- Every workout you do takes effort. In the same way a longer, more intense workout will burn more calories, a harder workout will result in a higher Effort score.
- Your workouts make you stronger and increase your fitness based on the amount of effort they took. Simply: Higher effort = higher fitness. Fitness improvement lasts over a few weeks, but slowly goes away without continued effort.
- Similarly, your workouts will also make you tired and increase your fatigue. Fatigue tends to decrease much quicker than fitness; in several days instead of several weeks, depending on the condition of the athlete.
- Your predicted performance is the positive balance of fitness over fatigue. Higher fitness and lower fatigue leads to maximum performance.
Simple right?
How to view training load in SportTracks
To view your fitness, fatigue, and predicted performance go to the Health tab:
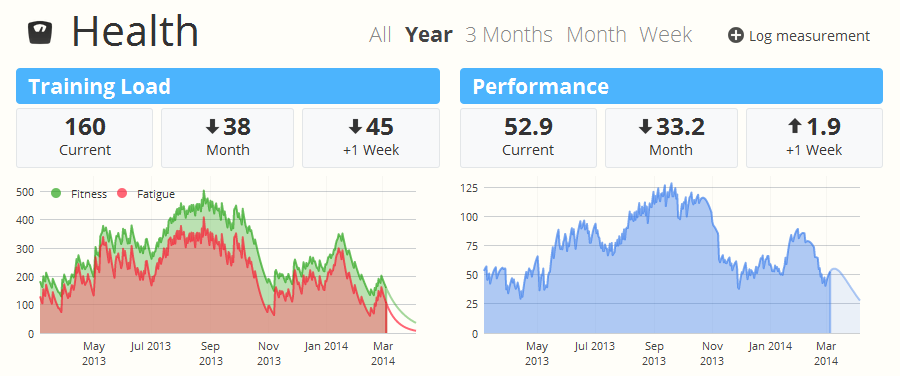
The first time you open the Health view the system may have to calculate your training load data. If you have several hundred workouts (or even thousands) this could take some time. Check back after a few hours if you don't see the charts appear immediately. Don't worry - the computers will keep crunching your numbers in the cloud even if you go away.
When your chart finishes processing, remember the descriptions above and observe times when your values were high or low. Use the filters at the top of the page to select a date range.
If you select 3 months or less for a time range you can also see your performance prediction for one month into the future, as well as the predicted value in one week (and +/- from current) above the chart. Performance predictions will also take into consideration any planned workouts you've scheduled; more on that in a future blog post.
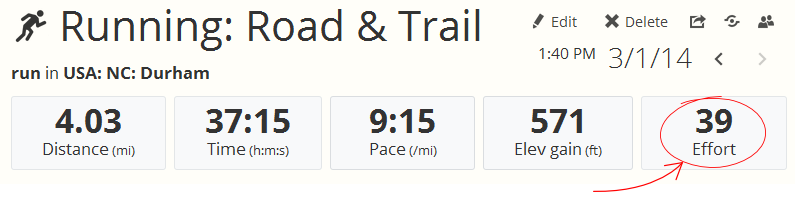
You can view individual workout effort in the workout detail page totals blocks:
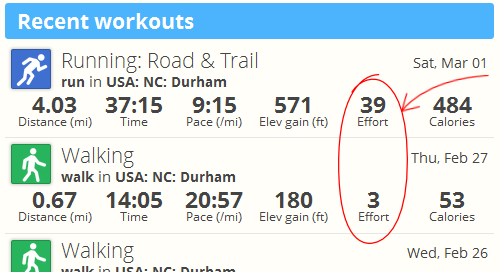
In the dashboard page:
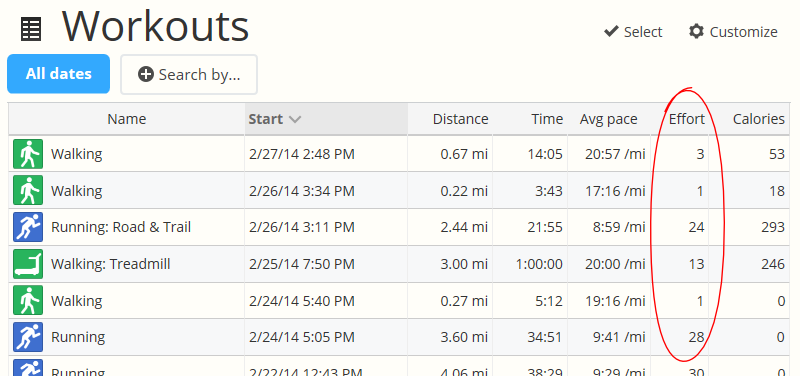
Or in the workout list page:
Coming up next...
For many people, the idea of using mathematical models to predict future performance is an entirely new concept and very exciting! If you're still a bit lost don't worry, we will help you along the path in the next week with the final post in this series: Reading the training load charts: Example scenarios.
If you already know and love training load - jump right in!
Comments
Will it be possible to have a training load chart for each type of sport ?
Also hover the mouse over a date and have the exact value at that date ?
A chart for each sport doesn't make sense as the model is "wholistic" - the numbers would be complete garbage if you remove sports.
YES: Hover and range selection (like in the workout details) is coming to health metric page.
Can you explain what the training load prediction numbers mean?
Currently I have Training Load 348, Month = down 25, 3 Month = Up 60, +1 Week = Down 99. It confuses me that 3 Month goes up when 1 month goes down. How can that be?
The same applies to Performance: Current 69,9, Month = Down 22.7, 3 month = Down 8.5, +1 Week = Up 24.4.
I have no planned exercises in the calendar, so I would have expected a prediction following the curve illustrated for the future in the graphs.
It seems like the calculations for walking are slightly off. A very slow walk of an hour/1.5 miles produces a higher effort score than a 40 minute/3.5 mile run
I'm very curious too about @Bjarne Maschoreck question. Someone in here to explain?
I do not get exactly how to read this. I can have 100 performance score while having 700 fitness or while having 300 fitness....
Does it mean performance of both athletes will be equal? That cannot be. What does 100 in that case mean? 100 what?
Thanks