We are introducing Training Load this week! This 3-part blog series highlighting Training Load begins with understanding the importance and usability of Training Load itself. When we showed this feature to our ambassador team the first response was overwhelmingly enthusiastic... immediately followed by a question:
"Okay... how does this all work?"
To better understand training load, there are two major concepts that must be covered:
Effort: Measuring the amount of effect a single workout has on your body.
Performance: Predicting performance changes over time from a series workouts.
Effort: TRIMP by any other name
Step 1 to predicting performance is calculating an effort for each workout. In concept effort is simple:
Effort = Intensity X Duration
In our system you can score 2 points per minute (120 per hour) at maximal effort. For example a 40 minute workout could score a maximum of 80 points. By simple math you can see how a short, high intensity workout (such as intervals) could score similar to a longer easy workout (such as a LSD run). Makes sense right?
Of course you're never going to be at maximal effort for an entire workout - this is where your GPS watch and other sensors come in:
We don't believe in obscure acronyms that require a scientist to understand...
- If you are a cyclist or runner and use a power meter, your effort is scored on power zones or FTP based on the effort basis option in your training settings.
- If you use a heart rate monitor, we score your effort based on your resting and maximum heart rate, and your zones.
- If you only have a GPS, your effort is scored on your speed/pace zones, adjusted for any hills you were running.
- For indoor endurance workouts or those without a GPS route, we score your effort on the average time in speed/pace zones.
- Finally if you're just doing a manual workout we use the value you've chosen for the perceived intensity of the workout.
If you're familiar with other software you may have heard something similar by various names: Training Stress Score (TSS), "Suffer Score", or TRIMP. We don't believe in obscure acronyms that require a scientist to understand so we've kept it easy to understand: effort. Besides, do you really want to keep seeing something that sounds like WIMP? I didn't think so.
We're also proud to say we use the most sophisticated algorithms on the market, and will handle any data scenarios you throw at us. We don't care if you're a triathlete swim-bike-running, if you're lifting weights, playing a game of volleyball, or finding your inner zen in a yoga class. You do it, we score it.
Performance: A three part story
After we've calculated all your effort scores for your entire workout history, Step 2 is to predict your fitness performance. Our performance model is based on the work Eric Banister started way back in 1975 and has been verified by dozens of studies.
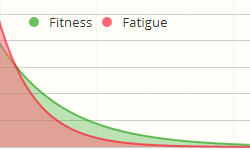
The model starts with an assumption that a workout has both a positive and negative effect. The positive effect is called "fitness" and the negative effect is called "fatigue". Fitness and fatigue are combined to provide "performance" - a prediction of how well you will do in an endurance event such as a race.
In the model both fatigue and fitness spike after a workout. Fatigue quickly drops off, while fitness drops off more slowly, creating a space of time where your fitness gains outweigh your fatigue, until both reach equilibrium again. This space represents your performance potential:
Performance = ( Fitness - Fatigue )
Illustrated by the two charts showing fitness, fatigue and performance:
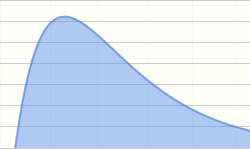
To bring this back to the real world imagine your ideal pre-race taper.
You've been putting on serious miles all season long, so your fitness is high, but so is your fatigue. As you begin to taper, the long-term fitness gains remain, but your fatigue drops with the drop in workout effort. As a result, you see a performance peak that (ideally) happens 7-10 days after your taper starts.
And then... race day. And you kill it, just as the performance model predicted.
Taking it into the future
We've gone through calculating effort for your past workouts, shown how training load will track your fitness and fatigue, and shown how the models predict your performance for a few weeks into the future. But we've left out one final exciting feature - adding planned workouts to predict your seasonal and race performance months in advance.
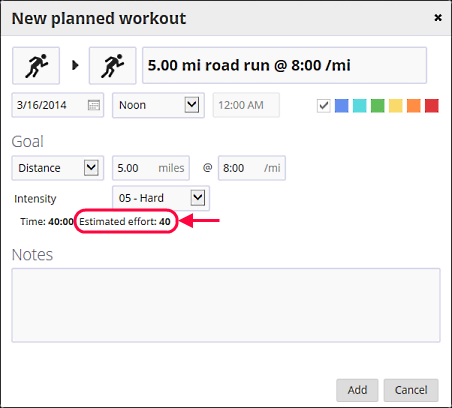
Using the same model of intensity and duration, it's possible to create planned workouts whose effort is estimated, and incorporate those numbers into your future training load. As your workouts are completed and your planned effort becomes actual effort the model refines goal to match reality. Pretty cool huh?
Create a planned workout and add your time or distance and pace, then set the intensity. You'll see effort calculated below, which will roll right into your future training load.
New to planned workouts? Check out our blog post Creating a training plan.
Coming up next...
For many people, the idea of using mathematical models to predict future performance is an entirely new concept and very exciting! If you're still a bit lost don't worry, we will help you along the path in the next few weeks with two more blog posts:
Comments
So the effort on cycling is calculated based on the power zones? It doesn't need a FTP-like test value ?
Same goes with running, no run test pace value ?
Yes to the first question. We use TRIMP[zone] for both power and pace, if you don't have heart rate values. So rather than a straight percentage of FTP you'll get efforts which are boxed by zones - higher zones = higher effort.
But no to the second question.
Your power zones should be set up based on a % of FTP, in the same way your heart rate zones are based on % of max HR. So there is some flexibility here on how many zones you set up and what they look like. But it's critical to set up zones instead of just entering your FTP to get proper power-based cycling efforts. And to set up zones, you need to know your FTP (if you're following Allen, Coggan, Friel, Carmichael, et. al.).
For those that have never heard of "FTP" it's essentially a way to estimate your lactate threshold by using a power meter and performing a time trial (an all-out 20 minute ride).
Great info here: http://www.kurtkinetic.com/test-training-zones-i-50-l-en.html
And... before you ask the question "isn't FTP just your 20 minute Critical Power, and aren't you showing that, so can't you just auto-calculate FTP and zones?" the answer is yes - the data is all ther, and we hope to add this feature in the future.
So just to cut this out in big letters.
If heart rate data is available, and power data is available.
You prefer heart rate and let that dominate the Effort calculation over power data???
It that is the case I think its very wrong-
Power is facts, so is heart rate but that is influenced by so many things.
100 watt is the same effort every day.
Johnny
Power is used first. You're exactly correct.
Sorry if that wasn't clear. I've edited the order in the blog post.
Question on effort and power zones. I watched your presentation on Training Load last night online and you mentioned using 5 zones and having too many zones may underestimate your effort level.
I've been using power zones defined by Coggan which are separated into 7 different zones in ST 3.1 and feel these zones are pretty well defined after a very good 20 min FTP test. I performed 52 minutes of cycling time last night mostly in zone 2 of 7 and have an effort score of 14. I feel that number is far too low.
How should I be defining power zones?
Yeah, not right. I took a look at this workout.
Check your Analysis page, and switch to Power. I noticed a lot of your time is in zone 1. Then I noticed your zone definitions and I think you've transposed the upper end of Z1. I think it should read 168 and not 186, right? So it looks like all that power is dumping into Z1.
Probably we need a big warning when setting up zones... "Your zones are overlapping, this is probably not what you want unless you *really* know what you're doing".
That's a very interesting critical power curve.
Thanks Aaron, that was the problem. I thought I changed the power zones but obvious;ly I didn't save them. I was using virtual power from a plugin in ST3 which corresponded to virtual power from Peripedal. I then bought a CycleOps PowerBeam and discovered the virtual power FTP was a bit inflated (wish I was really 50 watts higher) so I had to adjust.
I'm not sure I understand how "effort" works.
I completed a 10K race on Sunday. I raced with a plan to put maximal effort on the race. According to a previous blog post, a Maximal Effort scores 2 points per minute. I was close to one hour, so my effort should have been close to 120 points. A little less as I took me less than one hour, so I was expecting close to 100 points. When I uploaded my workout, ST.mobi scored it at 68 points. In my opinion, this is significantly lower that my effort out there on the course.
I have set up my heart rate zones (as per my VO2max lab test) and I recorded heart rate, pace/speed, and elevation.
Just to confirm, TrainingPeaks had this workout (same heart rate zones) at an Intensity Factor of 1.01, which is in line with the RPE of a maximal effort for one hour. TSS was also a little over 100, which again makes sense.
I need to understand how effort is measured in ST, as I need to decide if I can use the tool to plan my season or I stick with TrainingPeaks.
Thanks.
Heart-rate TRIMP uses your resting/max values as well.
Be sure to go to "My Account" and check those. I would bet they are not right.
Both Resting Heart Rate and Max Heart rate were ok...
I found out this too know. I uploaded a fake file with 1 hour effort on FTP - simulating a maximal effort I am capable to sustain for the given period. It calculated an effort of 69 for me. Did the same for HR at lactate threshold and 1 hour maximum running pace.
Only when I input wattage in my Zone 6 (the highest one) for 1 hour, it calculates the maximum of 120 points. Something impossible by the definition of the zones.
So the calculations of 120max are made against the highest zone, not the threshold value (FTP, HR at lactate threshold, threshold pace etc.)...
So the only way to get high effort (close to the 120 max) is to do a long workout in lower zones. It is impossible to get high effort for a workout done in threshold zone and higher.
In my opinion it is not very fortunate decision, as most endurance athletes are used to train regarding to their threshold values, which they try to measure very accurately. Not the max values.
I've been struggling with the effort calculations too and digging around a bit as a result. I've been comparing rides (same data) between TrainerRoad and SportTracks and find SportTracks effort value is always way below that of TrainerRoad's TSS value when I'd expect it to be the other way round based on the maximum of 120 points rather than the standard 100 points of TSS.
My FTP value and power zones are set identically in both programs.
After looking at the formula for TSS and rearranging it I've found that if I use a value of 65.26 maximum points per hour then I can calculate the Effort value exactly the same as SportTracks does. Which seems a little strange.
Just wondering if anyone else gets the same results?
How does Effort work for non-endurance workouts?
I have been recording gym strength workouts and it gives me an effort score based on manually entered time and intensity. Intensity I think is a bit of a guess here. Would it be more accurate if I tracked my strength workout with a heart rate monitor or is that really just for endurance workouts?
The other thing that comes into play is a lower body workout vs an upper body workout. Lower body will have more of an impact on fatigue for running. I guess it is just a matter of selecting an intensity that gives me an effort score that seems about right?
Yeah, intensity is a guess. You'll have to calibrate by looking at your endurance workouts and the Effort that pops out, then see if your strength workouts "feel right".
Probably what will happen is your different categories of strength workouts will use the same effort for the category. P90X vs plyo vs powerlifting vs different parts on different days - that kind of thing. So every time you do yoga, you're going to enter 2, and every time you do circuit training, you'd enter a 7.
We talked about a default for each category but decided not to add it. We're going to completely redesign and streamline adding manual workouts, so it will prefill previous intensity anyway.
I don't think a heart rate monitor is going to give you better data. The way TRIMP[zone] works, the zones must be tailored to the sport. Two problems here: 1) We don't have strength specific zones, 2) I don't know how you would set the zones anyway. In endurance sports we have well defined methods for setting zones by doing performance tests.
There is ZERO accommodation for different body parts. Actually you've got the same issue with for example hill training. This is a limitation of the model - it tracks fatigue and fitness "wholistically" for lack of a better word.
I've felt like the effort calculations have been too low with my 7 HR zones I set up according to Joel Friel, and have adjusted the zones back to a more traditional 5 zone setup. When I saved the changes, I was presented with the option to "Apply changes to historical workouts in the past". I expected ST.mobi to recalculate my running workouts to reflect the changes historically and have not witnessed any changes in effort calculations.
Am I wrong in thinking the effort scores should be recalculated if I checked the box to apply changes?
Calculations based on heartrate track are -NOT- using zones, they are using Max/Resting heartrate (HR reserve). In this article it's listed as 5 TRIMP[exp]:
http://fellrnr.com/wiki/TRIMP
So if you change ONLY your heartrate zones, your effort will not recalculate.
For non-HRM workouts which use pace/speed/power, those are calculated with zones, but I believe we optimize which values get recalculated. So for example, if you change power zones, it will only recalculate for power based workouts.
Training Load is derived from Effort (TRIMP). So whenever effort is recalculated the TL graph will be recalculated.
Hope this helps!
Thanks for the explanation, that did help.
Basically you're saying that in my case, since I'm using a HR monitor for my running activities, ST.mobi is breaking down the zones used for TRIMP independent from what my personal HR training zones and those zones are only used for my display.
Question regarding SWIM activities. In ST3 I upload swim workouts from a Garmin Swim device and manually input an Ave HR number which I feel corresponds with my perceived effort of that particular workout. In TL, I have a few zones defined for swim activities so I can get a TRIMP value calculated for use in the TL chart. What should I be doing in ST.mobi to get an accurate EFFORT record?
Good program this :)
Your calculations seems to be = TRIMPexp x 0,46
So imported workouts are correct according to this formula.
But when planning workouts you only do (% load/5) x time for trainingload, not taking personal zones in to cosideration (converting), so makes it a bit difficult to plan correct load when using time and pulse zones/pulse in planning.
Other than that id like some explanation from coloring, if u are in green/org/red zone fattigue wize.. I know that depends on a lot of factors (personal/health/nutrition etc) but a general estimat from an avaerge, taking your numbers from the curves in to account.
Hi - I'm starting not to believe on the TL results at all. Compared to other apps which also calculate this I find the results very awkward. Let me put an example. I manually inserted a cyclyng workout where I did not wear my HR monitor with following inputs: 70km, 30km/h average speed, 1112 calories, effort 4 (moderate). The result was a 'effort' of 280. However I used my watch on a very hard 4h hilly training (106km, 27km/h, 2600 calories, avg HR of 141 and a TE on Garmin of 4.5) and got...157. How could this be? Likewise I ran this morning 18.5km with average HR of 149, 1:35 and 1280 calories and got and effort of only 75, yet if I enter 45 min of gym at level 6 I get 54 (not so far). Actually when I change perceived effort nothing happens.
I'm starting to question your algorithm because unless I'm doing something wrong the stats don't make any sense to me, not even on a directional way.
Any help?
Recall from the blog posts that if you are using a heart rate monitor, the effort will be calculated based on the time you spend at various heart-rate levels in proportion to your minimum and maximum heartrate settings (in the My Account > Training tab), multiplied by duration (seconds) at that level. For me a workout at 140 HR wouldn't be terribly strenuous as my HR max is over 190. It sounds like you need to make sure your Max/Resting HR are correctly set in the training settings (lowered, probably). To reiterate - if you're using an HRM for a workout, the speed, calories, hills, and TE are irrelevant - the training load model only uses duration and heart rate in this scenario.
I'll also add that for cycling, power is the first metric used, then HR etc. If I do not have power numbers and go on HR alone, the effort recorded does not seem to match up with my rpe, but if power is recorded, I find the effort more in line. If my ride is at an intensity factor of 0.90, my HR often times does not reflect that for whatever reason, but power does not lie is the power meter is calibrated correctly.
I also have a Max of 196 and a "recovery" effort or paced run is around a 140 HR and is low stress. Remember also that the one hour all out effort is based on 120 points (two points per minute). My 30 minute recovery run at 140 average HR nets me about a 23 effort and seems reasonable on a 120 scale.
I'd also suggest to Beltran that he re-evaluate his min/max HR values. My guess is that the max is to low and the min is too high. Cycling Max HR is also typically 5-10 beats lower then running because there is gravitational component to cycling.
I have re-evaluated min/max HR. Min 55, max 175. Still no changes. What I find surprising is that on manually input routines changing from moderate to very hard has zero impact. Just as a test, I logged all my info on Trainingpeaks and got exactly what I expected - 4h on the bike would be quite a demanding activity whilst 45m run would be an easy one, and so on.
Overall I'm very dissapointed with sportstracks mobi. Whilst the GUI is very nice, the quality of these measurements is zero, at least compared to what I used to have on TP. The 35 USD plus the time spent seems a an investment lost.
Unless you tell me I'm doing something wrong I'm swapping back to TP.
Yep, there is definitely something fundamental you're missing. Seems like you've gone far off course from a question about the blog and into the land of a support ticket. I'll have someone shoot you over an email to diagnose what is going wrong ASAP.
EDIT: Definitely looks like a problem with your data, since 20 miles of your cycling workout is 50 BPM! Unless you were coasting downhill for an hour. Look for an email from support for data.
Hi Aaron,
I am new into ST Mobi, but I already knew ST3 before and training charts using felrnr's plugin.
First of all and based on your comments my understanding is as long as I use a heart rate monitor trimp will be calculated based in max/reserve heart rate, in this case I will use zones just to know time in each one for a given work out, is that correct?
I understand Basister's model offers a better approach of modeling performance, but I am used to look at TSB's.
So right now trying to change the method I would like to be able to find out some similarity.
I mean, i have read a lot and it is easy to understand concepts like fatigue, fitness and performance, it is the same concept in both models, but since in banister's model performance raises while you improve I cannot be sure when I am overtraining.
TSB always goes from positive values if you are resting/tapering to negative values if you train harder/overtrain,
how can I find something within the performance chart to know I am overtraining? for example if the performance chart decays more than x points? decays very fast? trying not to increase fitness very quick? is there any easy way to figure out I am pushing too hard and take a rest? I mean, looking at the training load chart it is pretty complicated to be able to see the difference between fitness and fatigue if the gap is closing fast, would it help to see this value calculated for the last week or something?
Thanks a lot in advance!
Is there an exact replica of this on ST3? I am trying to use both the online (mobi) and offline (ST3) versions of Sporttracks, and am confused by the relationship between the Training Load stats on ST3 and Mobi.
I am looking for a common reference to use for analysis and then going forwards.
you should try fellrnr's plugin on ST3, it is a great plugin. It implements both models and I strongly recommend to read his wiki site, really nice info.
Thanks JW, I have just started using this plug in and agree it is a very valuable resource, but am just a bit disappointed that there is not an identical read-out on the ST3 site as the mobi site (and wondered if there was a reason for that?).
We haven't build the training load models into the PC app. You can use plugins as mentioned, but getting them exact might be tricky, especially because the TRIMP calculations will be slightly different.
An easy workaround is to open the browser window along side the PC app. Admittedly it's not perfect, but it gets the job done.
For all the articles on training load there are a lot of questions, mostly based on people being used to other software etc. To get confidence with a new model, the best is to see the formulas behind and do the math yourself. Could you please provide the formulas?
You state performance (form) = intensity x duration.
Your also state that you don't like fancy names like TSS, TRIMP and so on, so instead you call it performance. But TRIMP and TSS and calculated with different formulas, so it could be nice to see the math behind.
You provided a link to TRIMP and from there I took the TRIMP exp formula =>
TRIMPexp = sum(D x HRr x 0.64 x exp(y) )
Where
D is the duration in minutes at a particular Heart Rate
HRr is the Heart Rate as a fraction of Heart Rate Reserve
y is the HRr multiplied by 1.92 for men and 1.67 for women.
You have also stated that you don't use HR zones when HR data are available. But D in the formula above requires the duration D at a specific HR (reserve). Does that mean that you use HR "zones" of 1, from HR rest to HR max? Or du you calculate the HRr in the formula from a "no-zone-HR" sp it is the fraction of the HRr as descriped, and then use the users HR zones when calculating the duration "D". I hope you understand what I mean :-) Is "D" duration time calculated at a 1-beat HR interval just as the HRr term in the formula - or do you apply zones to the "D" calculation?
How do you calculate the intensity when power data is available? The TSS formula takes into account both FTP, NP (normalized power) and intensity factor =>
TSS = ( (D[sec] x NP x IF) / (FTP x 3600) ) x 100, so biking with NP = FTP in 1 hour result in TSS = 100.
So please write the formula behind the calculations in a post, and it will give people the understanding and confidence they need to use the feature :-)
One last comment: You mentioned that FTP is the same as the 20 min critical power. I expect you said that to keeps things simple, because it is not the same.
How can a run over 6.5KM and a lower pace (4:40) result in an effort of 45, while a 10.1KM race and a higher pace (4:27) and with 85M in height result in an effort of 40? The only difference is that I haven't used my HR-strap during the 6.5KM run, but still the difference should be reversed and be much greater. This seems odd.
Pages