How to Use Training Load
A case study in running progression using SportTracks analysis tools
We athletes live in great times where there are abundant devices available with which to measure and collect data about our exercise workouts. Just spend some time on the SportTracks blog and you will see how much technology has become integrated into exercise. When I started doing triathlons in 1988 the only way to know how far I ran in training was to go back and drive the route to measure it. I was always an early adopter of technology and keen to learn from the data and spent many hours transcribing information into spreadsheets.
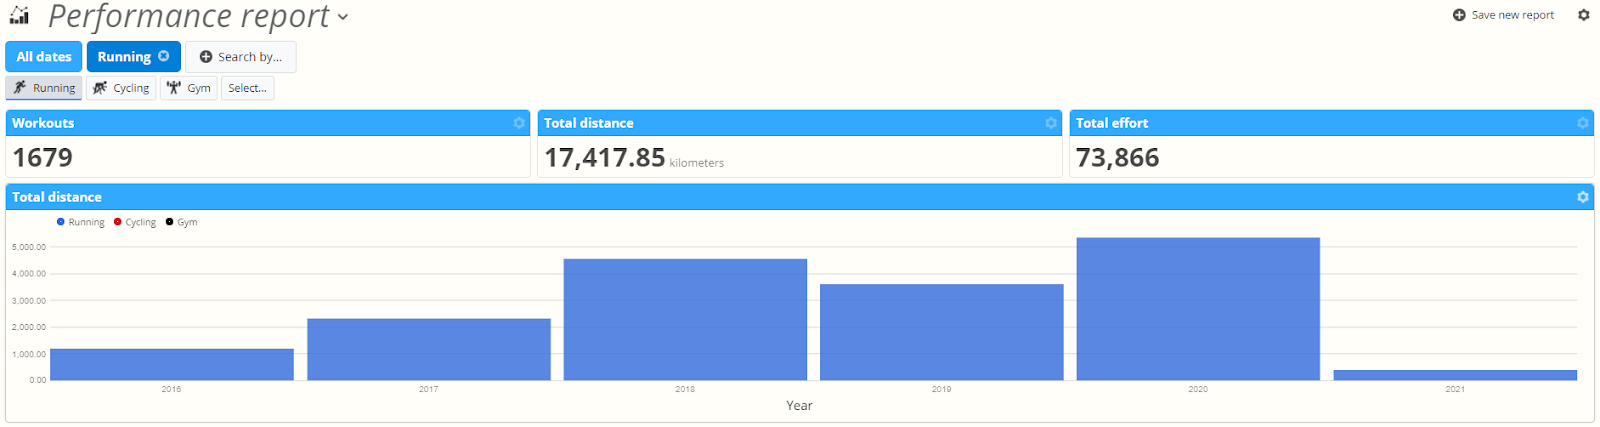
Fortunately, I discovered SportTracks eight years ago and have been using it in that time to monitor my own training loads while completing in triathlon and running events. I personally have invaluable data to draw on as I seek new goals as a veteran athlete. I have also been using SportTracks as a coach for five years and the ability to analyse my athlete’s data helps me to be a better coach. In this article I would like to share the progression of a runner who I have coached for five years using the SportTracks platform as a method to prescribe and monitor workouts. His name is Corey, and he is based in Brisbane, Australia. He has diligently recorded every workout and synchronized them with SportTracks where the workouts have seamlessly been assigned an effort score. His “Performance report” below shows a total of 1679 runs totaling over 17,000km in five years.
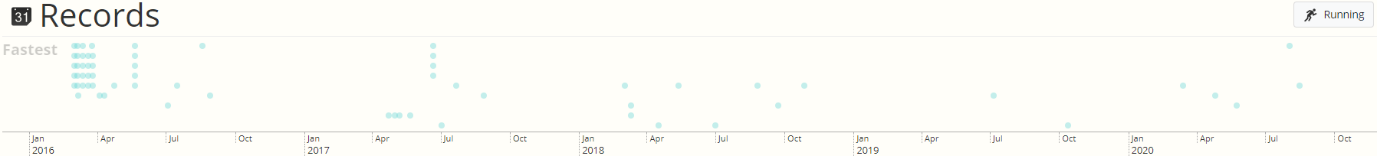
I believe the progression of increasing mileage year on year has contributed most to many personal bests (PB’s), rather than any special type of workout. Of course his training plan incorporates interval workouts and long runs, but a lot of zone two running as well. In the five years we have worked together I have seen Corey reduce his 5k best from 19:41 to 15:55, 10k from 39:35 to 33:55 and marathon from 2:59 to 2:46. The SportTracks “Records” chart was a very useful tool for me as a coach to look back and visually see his progression. What makes his current Pb’s even more remarkable is that they were done as solo efforts due to the lack of races in 2020.
I think I could count on my hand the number of runners who genuinely would not want to improve their PB’s as Corey has done. Unfortunately, I see the biggest barrier to achieving such progression is a lack of long-term thinking. Running is a hard sport and it can take many years to find your potential. For Corey we are still trying to find his potential and I am hopeful further improvements are possible. I believe he has the potential to lower his marathon below 2hrs40min. For someone who only took up running in his mid-twenties, with a single goal to break 20min at the local 5k race, this would be an outstanding achievement.
While I previously referred to Corey’s training in terms of number of runs and distance, what I am more interested in is an interpretation of these workouts in terms of total training load. There is a lot of scientific research around quantifying training load and one of the best models is TRIMP theory on which SportTracks health monitoring is based. I mentioned earlier that every one of Corey’s workouts has had an effort score calculated for it. By plugging those scores into a beautiful algorithm, SportTracks will calculate both your fitness and fatigue. I won’t go into that here, but I recommend reading an article titled Using Training Load from back in 2014 that explains it well.
...the biggest barrier to achieving such progression is a lack of long-term thinking.
If you are after the short explanation, the effort score of every workout you do will reflect intensity and duration. A higher effort score will reflect a workout that has stressed your physiology more than a lower effort score. In the context of running, this can be achieved by either running longer, or running faster, or a combination of both. There are many excellent articles on how to achieve that. But for the purposes of this case study, consider that if all the effort scores for all of the workouts are added up then we have an additional metric called training load to analyse.
While gains can be made by repeating the same training load every year, I am skeptical that will lead to your best possible performance. While the internet is loaded with many claims of “secret” workouts that lead to spectacular results, in reality they rarely do. There is nothing wrong with trying different workouts, it makes training more fun, but however you train there is a fundamental principal in exercise prescription called overloading in order to achieve physiological adaptations that lead to better performances. SportTracks provides an excellent visual method to see if you are doing this. As a coach my primary focus is to review an athlete’s long term training load and ensure that it is increasing. This doesn’t always mean that training has to be harder or more painful, the beauty of adaptation is that you adjust to the new normal. In simple terms, you become fitter.
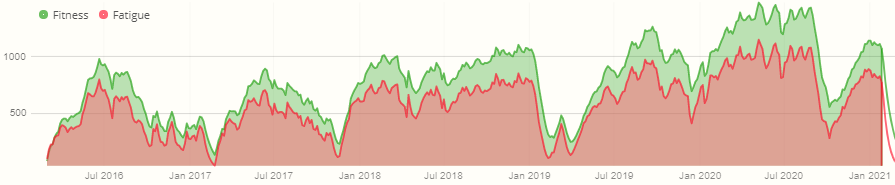
If my claim that by increasing total training load year on year should lead to adaptations, and in turn personal bests, is correct then I should be able to see that in Corey’s data. The chart below shows fitness and fatigue over the five-year period from early 2016 through to January 2021. The macro cycles are easy to spot as peak training load has improved from a score of 1000 back in 2016 up to 1400 in 2020. More importantly, you can see in the chart that more significant progression has been the ability to train at a higher load for longer periods. From the chart you can see that in the early years Corey was able to handle a training load of around 700 for 3 months before cutting back for a variety of reasons. It doesn’t really matter what the reason was, this up and down pattern is typical of an athlete’s year on year cycles as it would take a superhuman to maintain a high load indefinitely. What you can see is that his progression led to the ability to maintain a training load of around 900 for up to 5 months around 2018. This has now progressed in 2020 to develop the ability to maintain a training load of around 1300 for 6 months.
As a coach, my biggest mistake would have been to try and set Corey these big training load targets in the first few years of his journey as a runner, when his motivation to improve was high. I haven’t mentioned yet the importance of balancing fitness and fatigue and how they relate to performance. There is a good article on that called Training Load Example Scenarios. That nature of running is such that most athletes will experience injury. Corey has had two extended periods of injury in five years and it is difficult to say how much excessive training load contributed to that. The human body is like a complex machine and sometimes its limit is found at unexpected times. I like to reframe injuries as a learning opportunity and to reflect on the training load leading up to the injury.
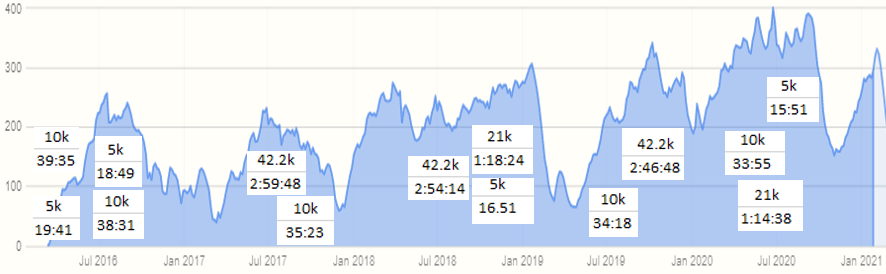
A longer-term focus on monitoring training load also has the positive benefit of knowing how quickly you can return to full training. Apart from the effect of injury downtime, if an athlete’s fatigue levels are controlled by incorporating recovery weeks and end of season breaks, then you should expect that the performance chart to correlate well with training load. I believe this phenomenon can be observed in Corey’s performance chart below. We can see very similar peaks, and durations, for the performance metric, as we saw in the training load chart. I have overlaid some of his PB’s on this chart and not surprisingly the timing of PB’s align with a long period of training load prior.
To benefit from this method of analysing your training it is important that you the athlete needs to put some extra time into making sure the effort score recorded in SportTracks is realistic. Don’t worry if it’s confusing at first, with time you will understand it better. Sometimes the algorithm makes a mistake if the data is corrupted due to an erroneous heart rate reading or GPS failure. These can be updated manually by assigning an intensity out of 100% instead. Absolute accuracy is not critical however as we are looking for large patterns of progression, so there is an acceptable margin of error. If you have an inaccurate effort score occasionally the impact on analysis is small when looking at cumulative training loads over years instead of months. One simple way to observe progression is to think about the blue area under the curve. The bigger this area is, the more you are likely to have accumulated more training load. And of course, if you just want to train then consider hiring a coach to do all this for you!
While I believe most athletes want to improve their performers and times, not everyone may be as ambitious as Corey who is prepared to make the year-on-year sacrifices to find his true potential as a runner. But if there is one takeaway I would like you to consider it is that taking time to review your previous years training load is worth doing. Once you have a sense of what training loads you are capable of, set some goals to both increase the training load you can achieve, and also the duration for which you can maintain it. If you look at the charts you can see that Corey is in a cycle coming back from an injury sustained late in 2020. As we work together on more PB’s we can be confident that the steep increase in load in 2021 is realistic as we have done it before. It is an exciting prospect to work with him and see what is possible in 2021.
 This article was written by Coach Mike Lennon, based in Brisbane, Australia. He coaches runners and triathletes online via SportTracks. If you're interested in training with him, visit his SportTracks Coach Profile or send him an email at coachmiketraining@gmail.com This article was written by Coach Mike Lennon, based in Brisbane, Australia. He coaches runners and triathletes online via SportTracks. If you're interested in training with him, visit his SportTracks Coach Profile or send him an email at coachmiketraining@gmail.com |
Comments
Very Inspiring article. Thanks!!
Any clue of how to handle Balance fitness percentage in the ST settings would be appreciated. It seems to be related to your persoal ability to recover, but is there any estimation or recomendation based on your age/gender/fitness...? Thanks
Hi Ignacio, I haven't experimented with the fitness balance setting in Sporttracks to explore if I can make additional insights and your question has prompted me to investigate this further. I agree it is a personal setting however and working that out accurately is most probably a dark art. I have been happy with the ST default settings and I believe what is more important is monitoring long term trends rather than attempting to predict performance on a short term basis. As an older athlete myself, the rate of decay for fatigue is definitely slower than for younger athletes but I havent changed my own setting. I think it is more important to make sure your zones are correct across different sports for both heart rate and bike power if you use it.
hi,
why, in my case, the difference between fitness and fatigue is very high?