Even simple workouts can create massive amounts of data when you use technology in training, and if your goal is to improve performance — properly utilizing this data is essential. Thankfully, learning how to do this in SportTracks is easy, and using your Effort score is a great example of this.
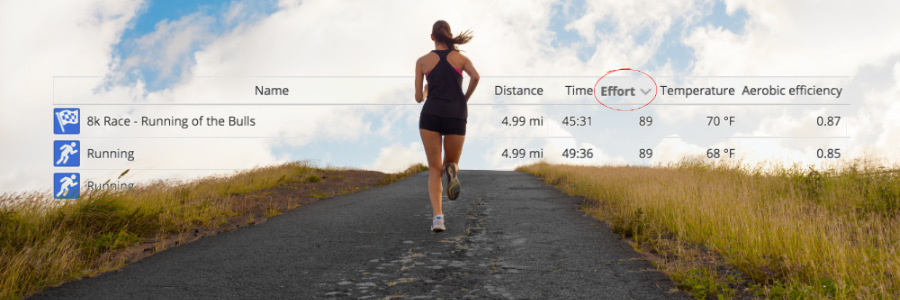
Your Effort score can easily be found at the top of your Workout Detail pages, and it can be added to the SportTracks Workouts page as well. Similar metrics can be found on other fitness platforms, such as TSS® on TrainingPeaks®, or the Suffer Score® on Strava®. It's intentionally called Effort in SportTracks to be as straightforward and non-confusing as possible.
Like the tools you'll find on other platforms, Effort is based on the Training Impulse model that was developed by the late Eric W. Bannister. Training Impulse, or TRIMP, helps you measure and evaluate the impact of your workouts and races.
TRIMP scores were used to manually create Training Load charts decades ago, but because SportTracks automatically creates a much more elaborate and accurate Training Load chart for you, these scores can be used to benefit your training in other, less time-consuming ways that are covered below.
What makes Effort unique
While other platforms require you to use a heart rate monitor or a power meter to utilize their version of this metric, SportTracks will work with any data you have. It prioritizes more precise data, such as power or heart rate zones, but in the absence of those it falls back on other metrics — even if you just manually add a workout and only input time and intensity.
You can accumulate a maximum of 2 Effort points per minute in SportTracks. So, a 1-hour workout at maximum intensity could theoretically net you 120 points (although, this is rather difficult to do). Single workouts longer than 1 hour can generate a far greater number of points.
Effort vs. RPE
An interesting and informative way to use your Effort score is to compare it with RPE (Rate of Perceived Exertion). RPE is a completely non-technical metric that can only be generated by the athlete. This is how it works: at the end of a workout, you simply to come up with a number from 1 to 10 that rates how difficult the workout was (10 = the most intense).
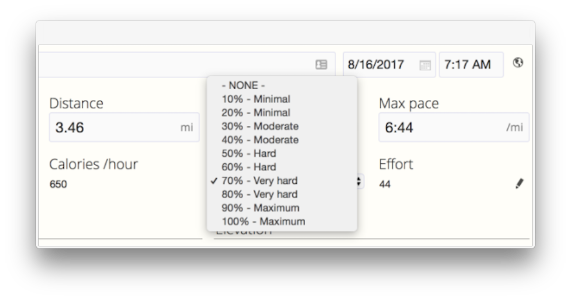
Again, the names for metrics in SportTracks are intentionally simplified, and RPE is called Intensity. You can easily rate each of your workouts and races with an Intensity score. When you're on a Workout Detail page, select the Edit button, then select Edit Details. On the next screen you can add your Intensity rating.
Imagine a workout felt rather strenuous, so you gave it an Intensity score of 80% (which is equal to an RPE score of 8). It can be enlightening to compare your Effort score to how the workout actually felt. If a workout was easy yet your Effort score was surprisingly high, it could be a sign that you're overtraining or perhaps in the early stages of being sick. If a workout felt difficult and your Effort score was low, it could be a sign that you need to work on your base fitness.
It should be noted that you have the ability to edit your Effort score in SportTracks. If you feel you need to change it for whatever reason, you can do so. We try to give you as many editing options in SportTracks as possible (you can even edit the weather that is automatically added to your outdoor workouts).
Targeting Effort Scores
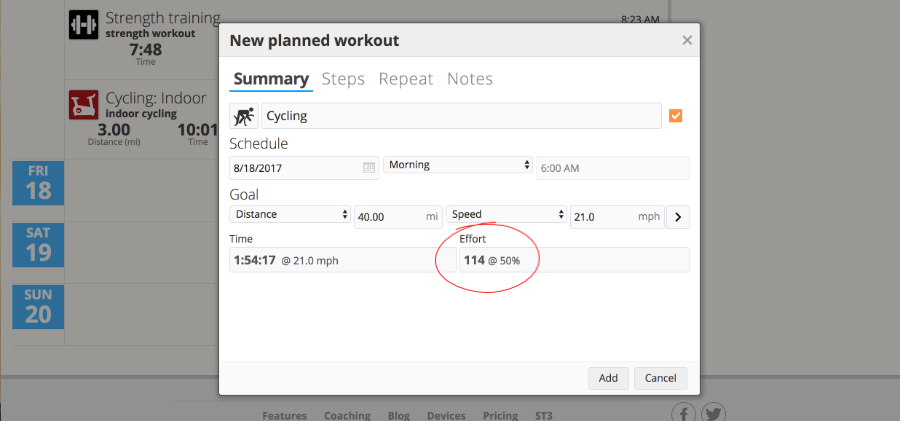
If you're following a training plan or just building up fitness for a race, you can target specific Effort scores for workouts, in order to hit a desired training intensity. When you add planned workouts to your SportTracks Calendar, you will be given an estimated Effort score based on the details of the workout you're adding.
You can do your workouts with a targeted Effort score in mind, but it helps to have an understanding of where they tend to land (by comparing them to RPE or analyzing past workouts). As you're executing a workout, you can intentionally increase your intensity in order to get a higher score. So in addition to helping you gauge your fitness, Effort can be a motivational tool.
How to get the most accurate score
The most accurate Effort scores are based on the power, heart rate, and pace zones that are found in the Training Options section of SportTracks. In order for your Effort scores to be finely tuned, you need to keep these training zones as up-to-date as possible in your profile.
You can determine your current training zones by yourself with the following tests:
- Running: Execute an LTHR test. This single test will determine your current thresholds and zones for heart rate, pace, and if you have a Stryd running power meter — running power as well.
- Cycling: If you have a power meter on your bike, execute an FTP test. You can determine your cycling HR zones by doing a 30-minute version of the FTP test, and using the average HR from the final 20 minutes.
- Swimming: A clock and a pool are the only things you need to determine your swimming pace zones, however, a bathing suit may be necessary.
As your fitness increases or decreases, your zones change. That's why it's important to test them every six weeks. When you update your zones, your Effort scores will be calculated based on the current settings. Likewise, when you add or remove zones (such as changing from five to seven zones), your Effort score will be calculated differently. This is important to keep in mind when you revisit older workouts for analysis.
If you have any questions, or if you would like to share how you use Effort, we would love to hear from you in the Comments section below!
TrainingPeaks® and TSS® are registered trademarks of Peaksware, LLC. Suffer Score® and Strava® are registered trademarks of Strava, Inc. Zone Five Software is not associated with Peaksware, LLC. or Strava, Inc.
| Article written by Sam Mallery, Director of Marketing, Zone Five Software Inc. |
Comments
The effort scores are excellent, and it's great to be able to compare fitness and fatigue levels over time. However, the future projection offset of these on the Health page means that it's impossible to historically compare these to the other measurements such as weight and body fat percentage.
Do you have any plans to allow users to either toggle this protection of add some dead storage to the other metrics to line them up?
You can find the customer idea tracker website and related idea here:
https://sporttracks.uservoice.com/forums/201951-general/suggestions/1769...
To review different metrics history you'll want to use the detailed metric info that pops up when you move your mouse over the chart. You can also click and drag to select a region to see details. You can also customize your health page layout for different number of columns if you like to have all the data you want to see on one page.
Yes - thats my 'idea' ! :)
However, I still very much disagree that this should be classed as an idea that needs to be voted for. Its clearly a bug in the way that the graphs are lined up, reducing their value.
Would be awesome to get effort graphs for the individual sports!
Sorry to revive an old blog post. Love the effort score. I am not quite sure how the FTHR is used during planning.
My planned effort (Inline skating) is often off (under) by more than 100%. E.g. a planned AeT steady state for 25 min, will give a planned effort score of 10, and the actual effort - when executed as planned - will result in a effort of 27'ish.
How does this work, what have I missed? And how do I use my FTHR for skating and where do I note it?
I only wished you would have chosen TSS model instead of TRIMP. :( I know they more or less show the same thing but the TSS is so much more user friendly and easy to follow and also more information online. I can also see my current TSS score on my Garmin which differs from your effort score. Even tough the Banister is more complex they both still make a lot of assumption so for me that argument doesn't hold up.
The TTS model is also easier to use for guidance. For example I know that generally I should have a TSB of between -10 - -20 when in heavy training and then taper up to +5-+15 for competition. In your model I have a performance index of around 850-900 when tapered which doesn't really say me anything and when in heavy training I don't have a performance number to follow. I have been using sporttracks mobi since launch and before that the PC app but now there are other free options like runalyze that let you do more advance analysis so I will stop using sporttracks mobi until you add the option to use the TSS model (wich you probably never will do)
I'm not sure that these comments are ever looked at. It certainly seems rare that they prompt a response.
I use the Mobi Effort as an indicator of what my TRIMP will be in ST. I can see this pretty much immediately and it is a reasonable indicator (for me TRIMP is approx 2.5x Effort).
But I have no idea what the numbers in the Fitness and Fatigue forms really represent.
In the ST plugin I know that when my TRIMP is sitting between 80 & 100 I'm in a good spot for racing.
Compared to Fitness?
When my negative TSB gets much over -15 I need to monitor, and over -20 back off.
What does that mean vs Fatigue?
Has anyone managed to draw a correlation between the two?
We don't provide customer support through the blog comments. You're welcome to open a support ticket via email if you need any assistance, there's a contact link at the bottom of every page. That will connect you to a support staff member for help.