Weather Tracking
Track weather to understand how it impacts your performance
As every endurance athlete knows - weather conditions are an important factor in your workout performance. Extreme cold or heat and humidity can impact your body's cardio and muscle systems. A strong headwind can crush your pace. Poor conditions can kill your motivation.
Being unfamiliar with your performance in different conditions can result in an unwanted race-day surprise when the weather changes.
That's why it's important to track weather conditions during your workouts. But remembering to enter conditions is a lot of work, and simply recording notes doesn't allow you to quantify the effects of weather.
Starting today we've enabled weather tracking in SportTracks, including the automated download of worldwide historical weather conditions and ability to edit all your workout weather data. This feature is immediately available for your entire workout history. Read on for details on this new feature and how to get the most of it.
Workout detail weather info
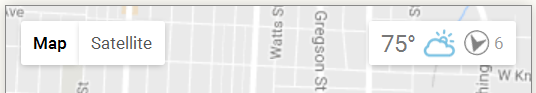
The first place you'll see weather is a small indicator in the workout details map section. At the top right of the map we now show temperature, conditions, wind speed and direction:
Clicking the weather opens a detail page:
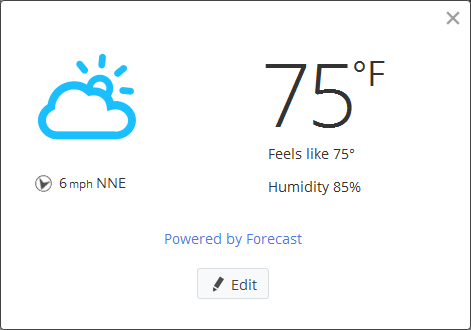
Here you'll see additional details such as the humidity and "feels like" temperature that incorporates wind speed, sun exposure and humidity. If your workout happens during extremely rare conditions, you may also see a special message. We’re not going to tell you all the messages you might see; you get to discover them on your own.
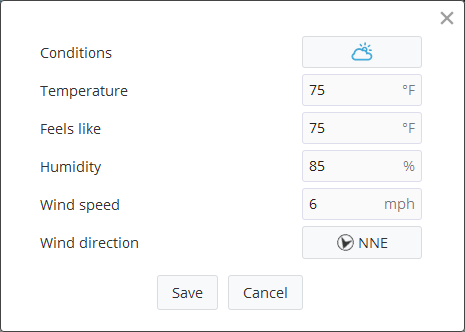
Weather data quality is highly dependent on your location, specifically, your proximity to weather stations included in the global weather database we use. For this reason, you may need to occasionally correct data that is off. Click the Edit button to edit your data. You have full access to all the weather data we track.
Tabular weather data
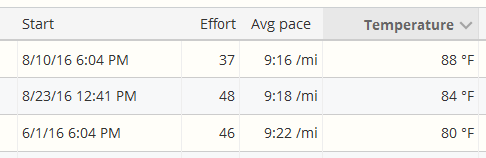
Looking at a single workout is a great way to understand how your performance may have been impacted by weather on that day. You can also tease out trends in your data by looking at the workouts view. Add the temperature column to show workout temperature and how it might relate to your pace on certain courses. You can use the same filtering options that you’re familiar with to find specific sport types, distances, or a speed range, then sort by the hottest or coldest temperature.
One of the best things about the new weather tracking feature is that it’s fully automated. There’s nothing you need to do to get weather data on your workouts. It just works; giving you more time to focus on the important things in your training plan.
Comments
And as with everything SportTracks does, this just works!! Nice one team!! Love it!! I've been using SportTracks way back to the ST2 days, and a weather plugin for the desktop app was one of the first add-ons I got. For mobi that data only translates to a note and wasn't visible in the summary or log views - this new feature has closed that gap. Thank you!!
This is great - thanks! Any chance that you can add Dew Point? This is typically a little more concrete measurement than "feels like." Thanks again!
Yeah. We're tracking temperature and humidity, so it's technically possible to calculate dew point.
However because "feels like" incorporates dew point, along with solar (cloud cover) and wind it can be a more useful single value over a broader set of weather conditions for a larger part of the training season when you're outside and exposed. We don't want to leave out people in Finland.
Related note: We get "feels like" from the weather data service. So they are dealing with the modeling of that value, rather than being something we calculate from the raw measurements.
Interesting. From this NWS definition of Heat Index, which I understand is the "feels like" temperature when it's warm, (http://www.nws.noaa.gov/forecasts/wfo/definitions/defineHeatIndex.html), it looks pretty cryptic, and I don't see anything about cloud cover and wind speed. If I'm looking at the wrong definition, please point me to the correct one. Based on some articles I've read, I have my own scale of how Dew Point affects my running, but I'm open to change. If the Dew Point calculation is pretty simple and considering it wouldn't take up much space on the UI, please consider adding it for those of us that like to use that measurement. Thanks for the information!
The key difference to understand is heat index is modeled as "in the shade with a light breeze".
As stated above, unlike a heat index, the "feels like" temperature includes wind and solar conditions, and thus covers a broader range of weather conditions, as opposed to just the hot + humid scenarios. It's useful for people who live in cold + windy climates, during winter workouts, and places with not a lot of cloud cover or where running in the blazing heat.
EDIT: There's a bit of "secret sauce" to how the feels like is calculated, but conceptually if the conditions are moderate cloud cover and no wind, the "feels like" and "heat index" should be the same, and the effect of humidity on how the temperature feels should be the predominant factor.
That's interesting, because I've seen a number of references saying that "heat index" and "feels like" are the same. That's all a little bit too much "black box" for me - I like a measurement that is easy to understand, like Dew Point. The wind and sun is already in your weather reporting, so adding Dew Point would allow me to still use that simple measurement, as well as factor in sun/shade and wind to give me a subjective heat index of my own :>) While cold conditions are certainly important to factor in, I would say that there are larger numbers of people that exercise in the extreme heat versus cold, at least so far as "extreme" defines the degree to which the weather actually affects performance.
Brilliant. I love this feature. Out of interest, is the temperature the average for the duration of the session or is it measured at the start? Min / Max would be perfect!
We collect one set of readings per hour. The temperature displayed is at the midpoint of the workout, from the closest hour. So for example if you have a workout that started at 7:30 am, and is 40 minutes, ending at 8:10am, we're going to look for the halfway point (7:50am), and use the 8:00am data.
I'm not certain whether we can get min/max values, but we could definitely get hourly values for long workouts and plot that. Might be useful for > 3h workouts. It's something we can research if enough people ask for it.
Thanks. It would certainly be good for long sessions / races to get more readings. I just looked at a marthon of a year or two back that had horrendous conditions - about 16°C at the beginning but about 32°C by the end with humidity as close to 100% as we get in Germany. The readings show 20°C and 67%, which would be about right for the middle of the race but don't really explain why I cramped up so badly afterwards that I needed a saline drip!
Aaron, this is great! Thanks for getting this up and running so smoothly
Couple of questions. First, can the "feels like" number be shown in the Workouts page? As you know, here in NC two 75F days can be hugely different for running when you add in the humidity and sun. Second, is any of this new data available for download through the API?
Thanks,
MB
Good job! Would be even better, if it syncs with the desktop software. As there is a special weather section in the summary frame of every activity this should be an easy task, I assume. Could you implement that, Aaron? Thanks a lot, Marc
I would also like that. Since I started to use the Online I have lost track of the weather information the desktop version used to pick up. Anoying. Hopefully a couple of years later we can get this back agin.
Any plans to expand this to more replicate the desktop capabilities? Having a graph that includes headwind/tailwind would be so much more useful than just a summary. There are so many data sources out there for weather - why are you restricting yourselves to just summaries? Couldn't you use some like WUnderground to crowd source a fuller data set? Is it an issue with data volumes?
This is great. However, I joined Sept. 1 and brought over 60 exercises from Suunto Movescount. The temperature shows for exercise going back to August 2nd but not before.
Hi Aaron, that's great to have weather info connected to each workout.
But would be possible to add " wind speed" and "wind direction" columns to workout summary table?
Thanks.
All my temperature readings have vanished from my activities sometime in the last week or so. It was always the only accurate site for temperature on my runs as it wasn't relying on dodgy Garmin data. The "Temp" column on Workouts is now blank, and on opening and editing an activity there is no temperature entry.
Would be really helpful to get these back as I have used them to compare runs of similar distance and intensity in context.....
*Actually I got it wrong. Its there but there is an issue with the layout so its scrolled off the side of the screen but the heading shows.
Is there a way to select a different weather station, like in the old stand alone version. I have a weather station 1/2 mile away from my home and it reports temperatures, and especially wind speed, much differently than the default weather station used by Sporttacks.
-- Hoby, in Idaho