SportTracks Glossary
Useful fitness terms
Acute Training Load is a measure of your current level of fatigue based on your efforts from the last 7 days and all of your workouts from the last 14 days.
» Find it in SportTracks
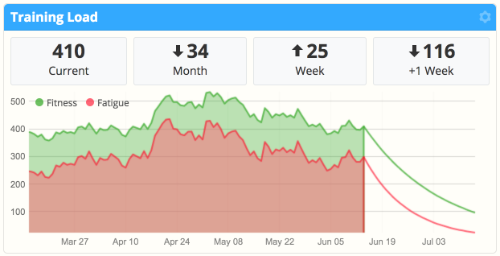
A comparable metric in SportTracks is your fatigue chart. It's found in the Training Load section of your Health page:
Average power is the central value (or mean value) of the power data collected in a workout.
Average power, which gives equal weight to low, middle, and high wattage, may seem like the best metric for an overall impression of the intensity of a workout, but this is not the case. A metric called nPower is more useful for this purpose because it gives higher wattage more weight. nPower provides a more accurate impression of the overall physiological cost of the workout because intense portions are more physically demanding.
» Find it in SportTracks
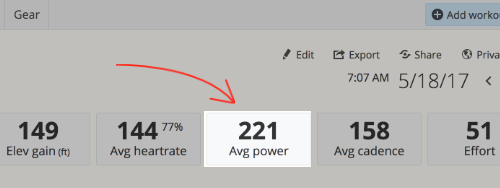
You can review your average power in the Total Block at the top of any power-based Workout Detail page:
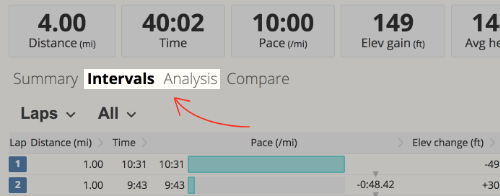
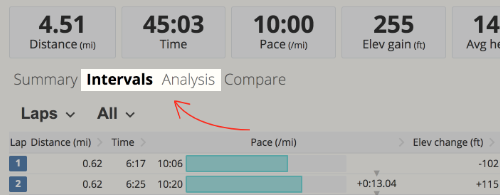
Average power is also in the Intervals tab where the average and max power for laps or hills are displayed, and it's also in the Analysis tab displayed as a zone breakout chart:
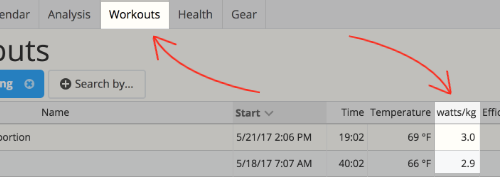
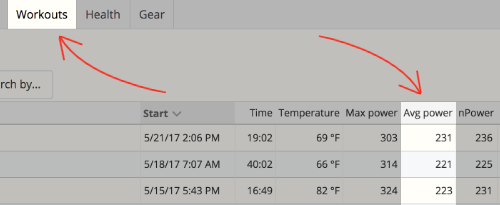
Average power can also be listed as a metric on your SportTracks Workouts page:
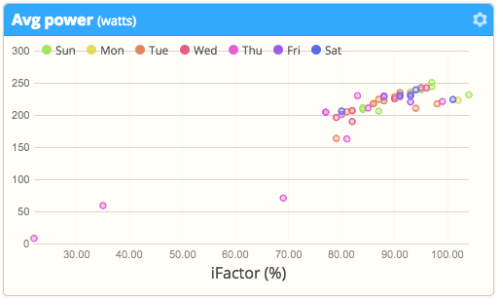
You can also make custom average power charts on your Analysis page:
In running, cadence is the total number of steps taken per minute. It is also referred to as SPM (steps per minute) and stride rate.
In cycling, cadence is the total number of pedal revolutions per minute.
In swimming strokes that alternate hands, cadence is the number of full strokes that one hand takes per minute. It is also referred to as stroke rate.
![]()
In running, it’s generally considered beneficial to maintain a minimum cadence of 160 SPM, and to strive for higher cadences of 180 SPM or greater. Taking more steps provides a smoother, more stabilized run. The smoothness decreases the physical impact on your body, helping you avoid unnecessary injuries. Running with a higher cadence also limits the possibility of overstriding, which is common cause of shin splints and other injuries. Cadence is closely related to vertical oscillation and ground contact time.
![]()
In cycling, it’s generally considered beneficial to ride with a higher cadence in the 90 - 110 RPM range. This results in an aerobic workout, as opposed to a muscular one. Spinning your legs quickly at higher cadences requires an easier gear, and spending the majority of your ride in an easier gear is less fatiguing, which means you can go farther, faster. Tracking cadence on a bike requires a physical sensor, but you can also manually count how many times one of your legs completes a revolution in 30 seconds, and double that number.
![]()
In freestyle or forward crawl swimming, it’s generally considered beneficial to maintain a cadence of 70 - 93. The goal is to minimize pauses in your stroke by gliding for a longer time than necessary, while not over exerting yourself and maintaining optimum form.
» Find it in SportTracks
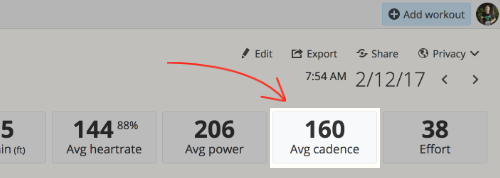
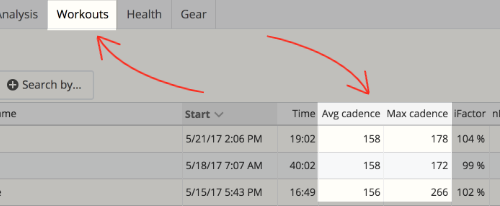
A dedicated Total Block for cadence is found at the top of your Workout Detail pages. For running, it displays average cadence and max cadence when you click on it:
Cadence is also in the Intervals tab where the average and max cadence for laps or hills are displayed, and it's also in the Analysis tab displayed as a zone breakout:
Cadence can also be listed as a metric on the SportTracks Workouts page by selecting the gear icon and adding it to the page:
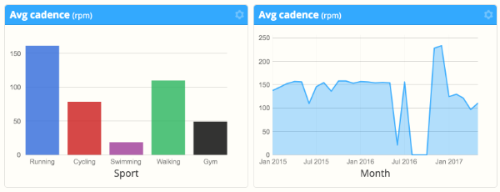
You can also make custom cadence charts on your Analysis page:
Chronic Training Load is a rolling average of your workouts, and it's intended to represent your current fitness level.
Typically viewed on a chart, your CTL will go up or down depending on how much you've been working out.
» Find it in SportTracks
A comparable metric to CTL in SportTracks is the Fitness chart in the Training Load section of your Health page:
The percentage of time your foot is in contact with the ground between steps.
Duty Factor is closely related to Ground Contact Time, but instead of being measured in lengths of time, it is presented as a percentage. This is done because GCT changes depending on running speed, which can make analysis difficult. Duty Factor isn't as influenced by running speed, making it potentially more useful for measuring your running economy.
» Find it in SportTracks
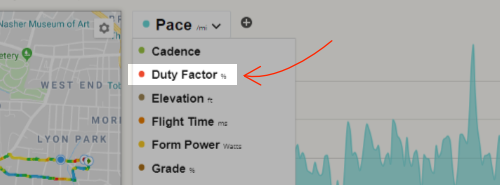
If you track runs with a sensor that records Ground Contact Time, Duty Factor can be found on your Workout Detail pages:
Efficiency Index (EI) measures of how much speed you achieved in relation to your power output.
EI is useful for comparing workouts on identical courses in similar conditions, to determine if you are improving by getting more speed per watt (data from a power meter is required for EI). Higher EI numbers indicate greater efficiency, such as getting faster at the same power, or achieving the same speed or pace using less power.
If you use a running power meter, EI is especially informative when you test it at your current Running FTP. On an identical course with similar conditions, run and try to maintain your current Running FTP. Afterward, when analyzing in SportTracks, determine if your EI improved or not, and compare this run with other identical workouts. This is called EI @ FT. If your EI isn’t improving at your FTP, train to improve your running form and test again.
» Find it in SportTracks
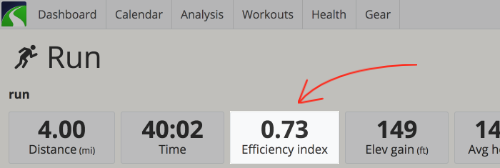
EI is found by clicking twice on the Total Block for Pace at the top of a workout detail page:
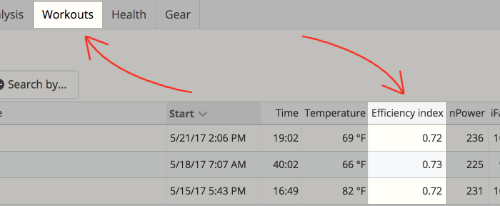
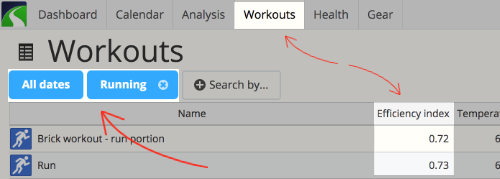
EI can also be listed as a metric on the SportTracks Workouts page, where you can easily stack workouts and filter them to list chronologically:
Efficiency Index at Functional Threshold (EI @ FT) is your EI when running at your FTP.
In endurance running, training to be more efficient is one of the most effective ways to improve. If you use a running power meter, you have access to a metric called EI, which rates your efficiency. When you run at your Running FTP, your EI can tell you whether or not your efficiency is improving at your FTP intensity, which is an important indicator of your current level of fitness.
» Find it in SportTracks
How to test your EI @ FT with SportTracks: Go for a run and try to maintain your current Running FTP. Afterward, when analyzing in SportTracks, you can determine if your EI improved or not by filtering your Workouts page by sport and date, and adding EI to the page by clicking on the gear icon. Compare this run with other identical workouts:
If your EI isn’t improving at your FTP, train to improve your running form and test again.
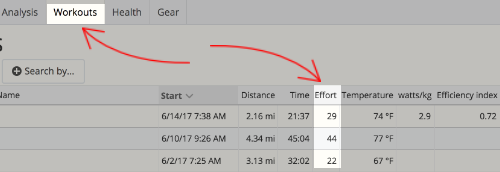
Effort in SportTracks quantifies the total intensity and duration of a workout.
Effort is based on training impulse, also known as TRIMP, which was developed by Dr. Eric Banister. It's calculated by multiplying intensity by duration, and normalizing the resulting number.
You can achieve a maximum of 2 points per minute, or 120 points per hour. It's possible to acheive an Effort score higher than 120 points by working out for longer than 1 hour.
Effort is calculated based on your current training zones, and on the quality of data in your workout. For the most accurate results, test your training thresholds every six weeks, and update your training zones in SportTracks accordingly.
Effort uses the following data hierarchy for calculation:
- Data from a cycling or running power meter, based on your power zones
- Data from a heart rate monitor, based on your resting and maximum heart rate, and your heart rate zones
- Data from GPS, based on your pace/speed zones
- For workouts with no GPS, Effort is based on your average time in pace/speed zones
- For manually uploaded workouts, Effort is based on preceived intensity
» Find it in SportTracks
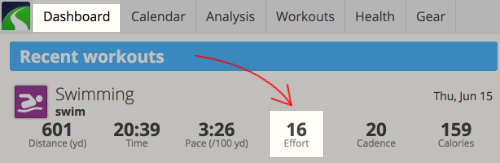
Effort is found on the SportTracks Dashboard:
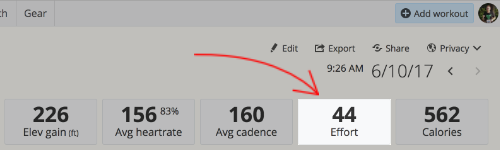
Effort is displayed in a Total Block at the top of any Workout Detail page:
Effort can also be listed as a metric on your Workouts page by clicking the gear icon and adding it:
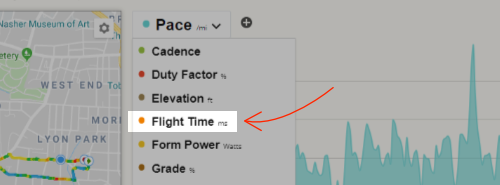
Flight Time is the amount of time you spend off the ground between strides when running.
Flight Time is the opposite of Ground Contact Time, as it's a measurement of the amount of time you are not in contact with the ground with each step. It can be used to analyze your running form. It's generally considered beneficial to spend more time in the air and less time on the ground when running.
» Find it in SportTracks
If you track runs with a sensor that records Ground Contact Time, Flight Time can be found on your Workout Detail pages:
Functional Threshold Power (FTP) represents the maximum power you can consistently maintain for one hour.
FTP is a personal training and racing benchmark that’s based on data from a power meter. It’s used in cycling and running to measure your current best effort so you can precisely target your training, and it can strategically be used in racing to put in the most competitive effort possible.
![]()
You can determine your Cycling FTP by conducting a simple test, either outdoors on a course with a slight incline where you won’t be slowed down by traffic or sped up by descents for 30 minutes non-stop, or on an indoor trainer (although, power tends to be higher outdoors). Warm up for 10 minutes and include a couple of short, increased intensity intervals, then go as hard as you can at a consistent intensity for 20 minutes. The average power from the 20 minute effort minus 5% is your Cycling FTP.
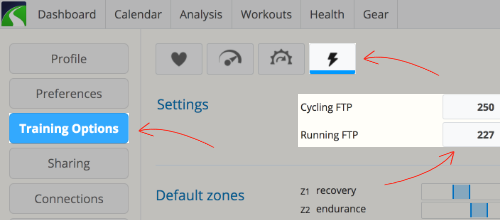
After the test, go to your Power settings in SportTracks, type in your new Cycling FTP wattage, and hit Save. You should retest your Cycling FTP every six weeks, so it’s always up-to-date with your current level of fitness.
![]()
You can determine your Running FTP by conducting a 30 Minute Time Trial test, which is the same test used to determine your lactate threshold heart rate (LTHR). You need a running power meter and a flat, uninterrupted course to run on (such as a track). Warm up for 10 minutes, then run at the fastest pace you can consistantly maintain for 30 minutes, then cool down for 5 to 10 mintues. Wear a heart rate monitor if you have one, so you can use this test to determine your heart rate zones as well.
After the test, upload this workout to SportTracks, and highlight the final 20 minutes of your "all-out" effort. The average power from this time is your Running FTP. The average heart rate is your LTHR. The average pace from the entire 30 minute all-out effort is your threshold pace. Retest your Running FTP every six weeks, so it’s always current with your level of fitness.
Lastly, go to your Power settings in SportTracks, type in your new Running FTP wattage, and hit Save.
» Find it in SportTracks
In the upper left corner of SportTracks, select My Account, then the Training Options tab, then the Power tab at the top:
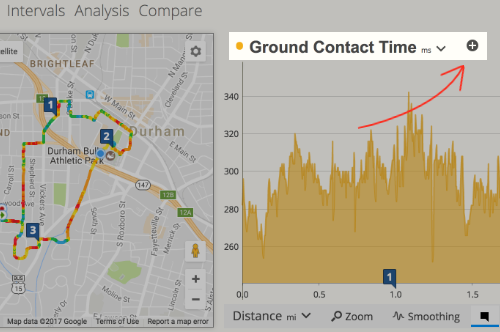
Ground Contact Time (GCT) is the duration of time that one of your feet is in contact with the ground on each stride when running.
GCT is closely related to cadence and vertical oscillation (VO). The goal is lower your GCT (spend less time on the ground and more time in flight), while keeping your VO as low as possible. In general, your GCT should be below 300 milliseconds, and ideally in the 200 to 175 millisecond range.
Recording and monitoring GCT requires specific sensors, such as the Garmin HRM-Run heart rate monitor (when used with a GCT capable watch, like the Forerunner 935), or the Stryd footpod.
» Find it in SportTracks
In workouts that included GCT-capable equipment, it can be added as an overlay metric on the chart in the Workout Detail page:
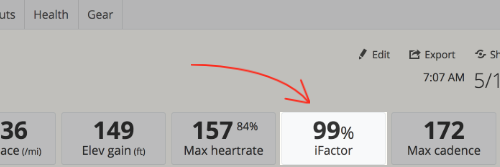
iFactor is the relationship in quantity between your nPower and your FTP, and it represents power intensity.
Expressed as a percentage, iFactor tells you how close you came to meeting or surpassing your FTP.
» Find it in SportTracks
You can click on the Total Block for Power four times at the top of any power-based Workout Detail page:
iFactor can also be listed as a metric on the SportTracks Workouts page by clicking the gear icon and adding it:
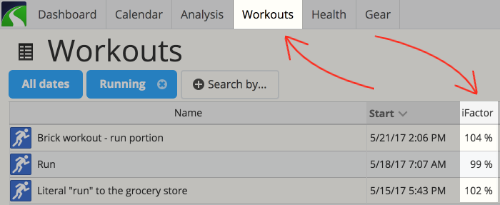
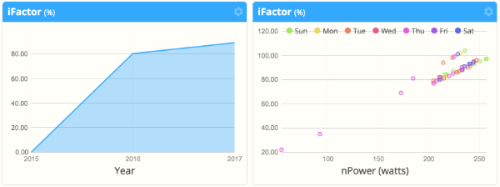
iFactor can also be charted as a metric on the Analysis page:
Intensity Factor® is the ratio of normalized power to your FTP.
Intensity Factor® enables you to easily compare the intensity of a workout in relation to your current FTP. This metric is displayed as iFactor in SportTracks.
» Find it in SportTracks
iFactor, which is the SportTracks equivalent of Intensity Factor®, is found by clicking on the Total Block for Power four times at the top of any power-based Workout Detail page:
iFactor can also be listed as a metric on the SportTracks Workouts page by clicking the gear icon and adding it:
iFactor can also be charted as a metric on the Analysis page:
Intensity Factor® and IF® are registered trademarks of Peaksware, LLC. Zone Five Software is not associated with Peaksware, LLC.
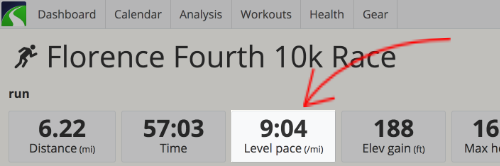
Level pace compensates for how hills slow you down and speed you up in running, to provide a neutral interpretation of your workout.
You may be training to improve various parts of your run, such doing speedwork or working on your form, but, you likely don't run on identical courses everyday. This can make it difficult to determine if you're improving or not, because it's hard to compare one run against another.
Level pace (which is also known as Grade Adjusted Pace) provides a way to equally compare your performance from workout to workout, regardless of how hilly the various courses may have been.
» Find it in SportTracks
You can find level pace in on your Workout Detail pages for running workouts by clicking the Total Block for pace at the top:
Normalized Power® accurately measures the physiological cost of a workout by accounting for variations in intensity.
Workouts with intense intervals are typically more physically taxing than workouts with steady, consistent flows. This is why only analyzing the average power from a workout can be insufficient. Because Normalized Power® gives more weight to intense efforts, it provides a more accurate representation of the physiological cost of the workout. Normalized Power® is calculated and displayed as nPower in SportTracks.
» Find it in SportTracks
nPower, which is the SportTracks equivalent of Normalized Power®, can be viewed in SportTracks by clicking once on the Total Block for Power at the top of any power-based Workout Detail page:
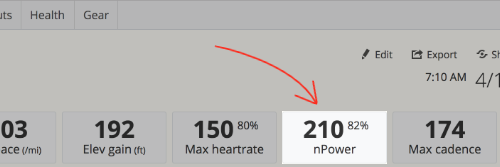
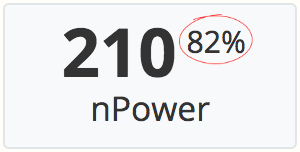
The circled number in your nPower Total Block is your iFactor (the % of your FTP that you set in your Training Options for Power):
nPower can also be listed as a metric on the SportTracks Workouts page by clicking on the gear icon and adding it:
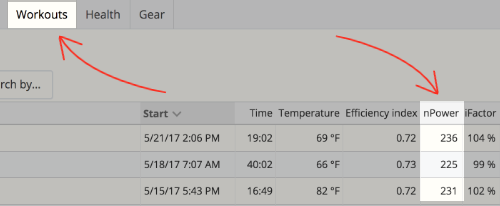
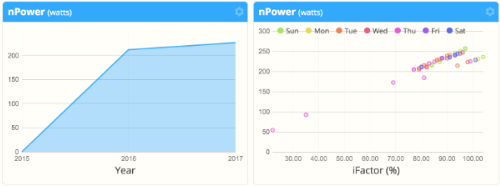
nPower can also be charted as a metric on the Analysis page:
Normalized Power® and NP® are registered trademarks of Peaksware, LLC. Zone Five Software is not associated with Peaksware, LLC.
nPower is a variation of Average Power that gives more weight to intense efforts in order to provide a more accurate representation of the physical cost of a workout.
Hard efforts are more physiologically demanding, that’s why giving them more weight when averaging the total power of a workout is useful. For example, a workout in which you maintain 225 watts consistently for 30 minutes isn’t as physically demanding as a workout of the same duration with several intense surges, yet with an overall average power of 225 watts. If you looked at the average power of these two workouts, they would seem equal, but if you looked at the nPower, you could tell that the workout with the surges was more intense.
» Find it in SportTracks
To view your nPower, click once on the Total Block for Power at the top of any power-based Workout Detail page:
The circled number in your nPower Total Block is your iFactor (the % of your FTP that you set in your Training Options for Power):
nPower can also be listed as a metric on the SportTracks Workouts page by clicking on the gear icon and adding it:
nPower can also be charted as a metric on the Analysis page:
Power variability measures the dynamics of a workout: if there is even intensity from start to finish, the power variability number will be low, if there is variation in intensity, the power variability number will be higher.
Power variability is determined by dividing your nPower by your average power. When your nPower and average power are equal, your power variability = 1.00. Higher power variability numbers have more or greater intensity surges.
For example, a workout in which you maintain 225 watts consistently for 30 minutes will have a lower power variability score than a workout of the same duration with several intense surges, yet with an overall average power of 225 watts. If you looked at the average power of these two workouts, they would seem equal, but if you looked at the power variability, you could tell that the workout with the surges was more intense.
» Find it in SportTracks
Click on the Total Block for Power five times at the top of any power-based Workout Detail page:
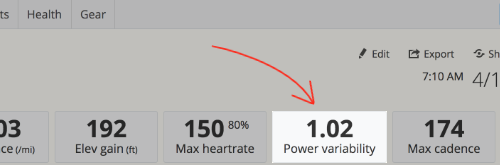
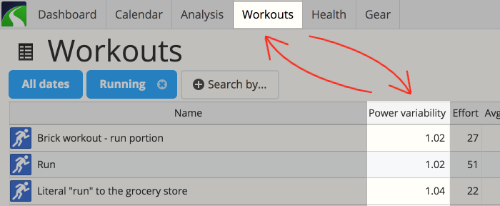
Power variability can also be listed as a metric on the SportTracks Workouts page by clicking the gear icon and adding it:
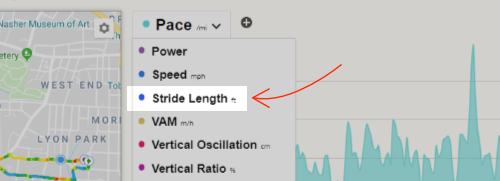
Stride Length is the distance you cover with each step.
Measured from toe-off to footstrike, Stride Length is rather self-explanatory. It can be useful to gauge your running efficiency — especially when compared with Vertical Oscillation, Cadence, and other workout metrics.
In order to monitor and record Stride Length, you can wear a Garmin Running Dynamics capable Forerunner-series watch (such as the 935), and an additional sensor (the HRM-RUN or HRM-TRI chest straps, or the RD Pod). Another option is to use the Stryd footpod with a compatible watch from Suunto, Polar, etc.
» Find it in SportTracks
If you use the required hardware, you can find Stride Length in your Workout Detail charts:
Training load is a complex set of mathematical models that predict your performance based on past workouts, and workouts you have planned in the future.
Two things happen when you workout: your fitness improves and your fatigue increases. When you stop working out, your fitness and fatigue both decrease, but your fatigue decreases at a much faster rate.
Training load is a section of the SportTracks Health page that displays your current levels of fitness and fatigue, and it predicts how they will trend for a full month into the future. If you have workouts planned in your SportTracks calendar, you will see how they influence your fitness and fatigue levels in the weeks to come.
Being able to quickly gauge your fitness and fatigue levels can help you avoid overtraining (this happens when your fatigue level gets too close or overtakes your fitness level). It also enables you to more accurately taper for a race. Since your fatigue level drops faster than your fitness level, you can strategically plan your workouts so that you achieve maximum fitness and minimum fatigue on race day.
» Find it in SportTracks
Training load is found on your SportTracks Health page:
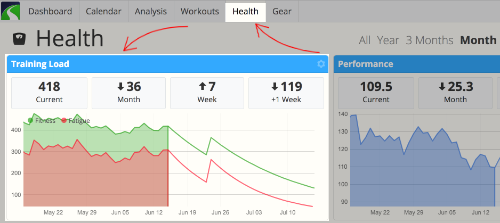
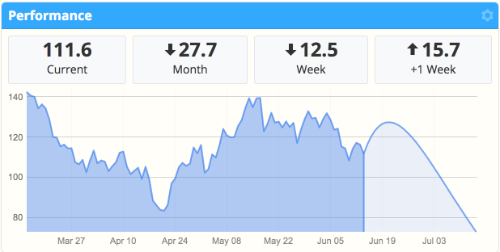
Training Stress Balance calculates your current race readiness by subtracting your fatigue from your fitness.
» Find it in SportTracks
A comparable metric in SportTracks is the Performance chart on your Health page:
TSS® is a value that quantifies the total intensity and duration of a workout.
TSS® is partially based on TRIMPS, or training impulse, which was developed by Dr. Eric Bannister. TRIMPS is calculated and displayed as Effort in SportTracks.
The two values scale differently:
- The maximum number of TSS® points = 100 per hour
- The maximum number of Effort points = 120 per hour (2 per minute)
Effort scores are therefore 20% higher than TSS® scores.
» Find it in SportTracks
Your Effort score, which is a comparable metric for TSS® in SportTracks, is displayed in the Total Block of any Workout Detail page:
TSS® and Training Stress Score® are registered trademarks of Peaksware, LLC. Zone Five Software is not associated with Peaksware, LLC.
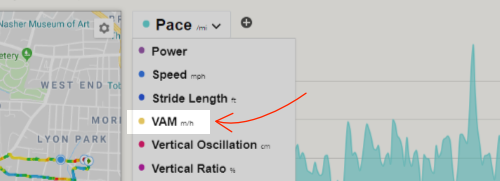
VAM is the number of vertical meters you climb per hour.
VAM comes from Italian cycling coach Michele Ferrari, and the acronym is comprised of the words Velocità Ascensionale Media. Think of this metric as a vertical version of speed. It's measured in vertical meters per hour (vmh), as opposed to miles or kilometers per hour.
VAM data is useful to monitor during a workout, and also afterward in post-workout analysis — especially when comparing workouts. During rides, you can develop an understanding of your average VAM on specific climbs. When you return to these climbs, you can work to outdo your previous performance by riding at a higher VAM. In post-workout analysis, you can compare your performace with other metrics like power and heartrate, compare identical climbs or climbs of a similar grade, and also see if other factors were an influence, such as the weather.
» Find it in SportTracks
If you tracked a workout with GPS, you can access VAM data in the main chart of the Workout Detail page:
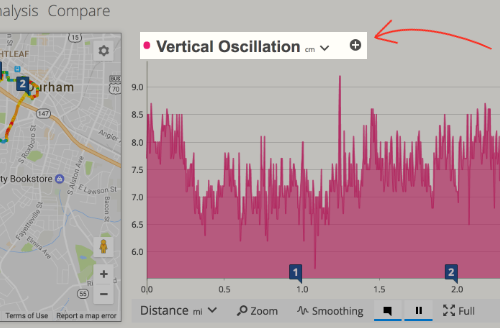
Vertical Oscillation (VO) is the distance of the vertical bounce of your body when running.
In general, it’s beneficial to have a lower VO, this way you will waste less energy propelling your body up and down and run more efficiently on the horizontal plane.
Recording and monitoring VO requires special equipment, such as the Garmin HRM-Run heart rate monitor or the Garmin RD Pod (when used with a compatible watch, like the Forerunner 935), or the Stryd footpod.
Vertical oscillation is closely related to ground contact time and cadence.
» Find it in SportTracks
In workouts that included VO-capable equipment, it can be added as an overlay metric on the chart in the Workout Detail page:
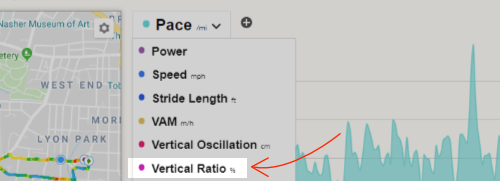
Vertical Ratio is the relationship between Vertical Oscillation and Stride Length.
Vertical Oscillation is the amount your body bounces when you run, and Stride Length is the distance you travel with each step. Vertical Ratio is the relationship between the two. If you train to have lower Vertical Ratio numbers, you will waste less energy bouncing while covering longer distances with each stride. This metric can be used to achieve a more efficient running form.
To record Vertical Ratio you can wear a Running Dynamics capable Garmin watch like the 935, and an additional Garmin sensor (the HRM-RUN or HRM-TRI chest straps, or the RD Pod). Another option is to use the Stryd footpod with a compatible watch from Suunto, Polar, etc.
» Find it in SportTracks
If you use the required hardware, you can find Vertical Ratio in your Workout Detail charts:
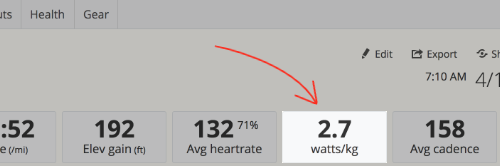
watts/kg is power relative to weight.
This metric is useful for comparing athletes of different body types to one another, and it’s a very effective metric to target in order to improve in cycling.
These are the three goals for cyclists in regards to watts/kg:
- Try to maintain the same power at the same weight
- Try to maintain the same power while losing weight
- Try to increase power while losing weight
While watts/kg is an effective metric to watch in cycling, it’s less important if you run with a power meter. This is due to the complex biomechanics of running, where more watts do not always result in more speed. In this regard, a more critical metric to analyze in power running is EI @ FT.
» Find it in SportTracks
Click twice on the Total Block for Power at the top of any power-based Workout Detail page:
watts/kg can also be listed as a metric on the SportTracks Workouts page: