Training Load: Example Charts
All you need to know about reading training load charts
This is part 3 of our series on training load. If you just landed here, please read our other posts first for a background on training load Predicting fitness performance with training load and Training load: Science, history and application.
In this post we're going to turn to some examples so you get a better feel for how training load charts look:
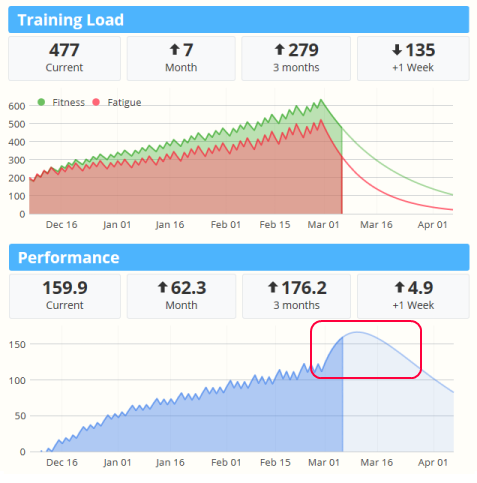
All the examples below include the two training load charts you'll find on the Health tab which we've stacked vertically for readability.
Why constant training leads to diminishing improvement
The first example shows a 16 week training plan with a constant weekly intensity over the entire plan. This plan starts the 1st week of December and has a 1 hour workout of moderate intensity on Monday, Wednesday, Friday:
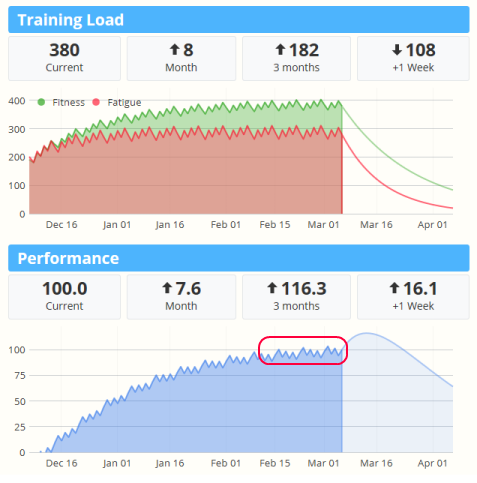
As you can see, fitness and fatigue are closely matched near the first few weeks of the plan, with performance actually in the negative range. As the season proceeds the longer term fitness gains are realized, and the gap between fitness and fatigue quickly increases, resulting in improved performance.
However, by the start of February the performance gains are slowing. Because we are training at a constant rate of 3 hours per week, we've reached the maximum potential performance near a value of 100. To push higher, we're going to need to increase our effort - either through longer duration, or higher intensity.
Increase performance with base building and recovery
The second example starts with the same plan, but after 6 weeks we begin increasing effort by 10% per week for 3 weeks, followed by a week of recovery where we back off. The plan repeats a second time, ending at about 2x times the original weekly effort:
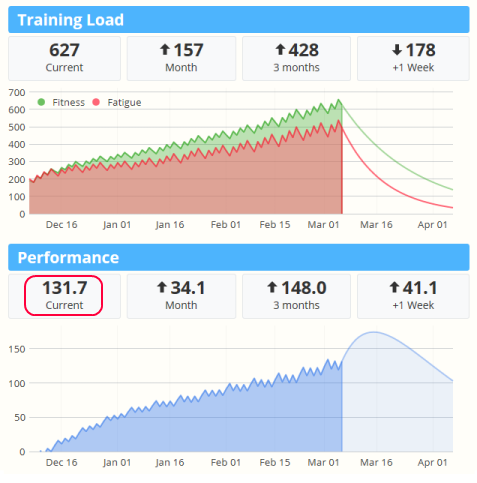
Two things should immediately jump out at you:
1. Instead of a performance plateau, we see a constant trend up.
2. Total performance is a lot higher (over +30%) ending at 132.
This is good. But there are a few more things we can pull out which are more subtle:
3. Fitness is improving, but so is fatigue. We should be mindful of our energy and intensity level as we increase, making sure each workout hits our targets.
4. Each workout has a greater effect as shown by the larger day-to-day spikes. A large spike could warn of an over training injury.
To illustrate the second point, lets look at an extreme hypothetical example.
How to overtrain and injure yourself in one chart
If a 10% weekly increase helps your build performance, why not increase by 20%, or 30%? And screw those recovery weeks, right? Who needs em? This last chart illustrates that scenario:
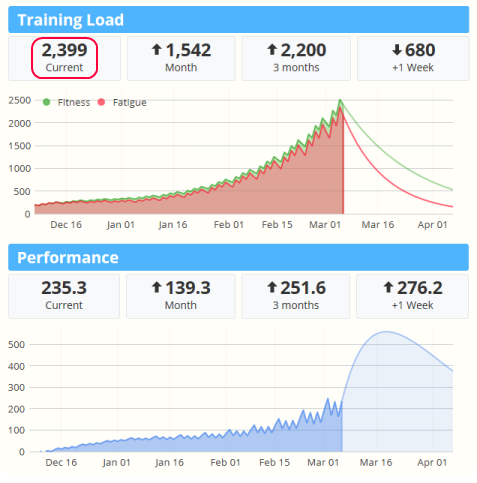
Here we see our performance nearly doubles to 235. However you'll also notice our fatigue has jumped by nearly four fold from around 630 to almost 2,400! And look at how large those daily performance spikes have gotten. While the long term trend is heading up, it's almost as if each day is struggling to push higher. It's no wonder as you can see fitness and fatigue closely tracking together rather than building a gap. This is what over-training looks like in a performance chart.
Putting it together with the taper
The final example shows two one-week tapers and their effect on your predicted performance. In the first example, the last 3 workouts rapidly diminish in intensity going into the weekend:
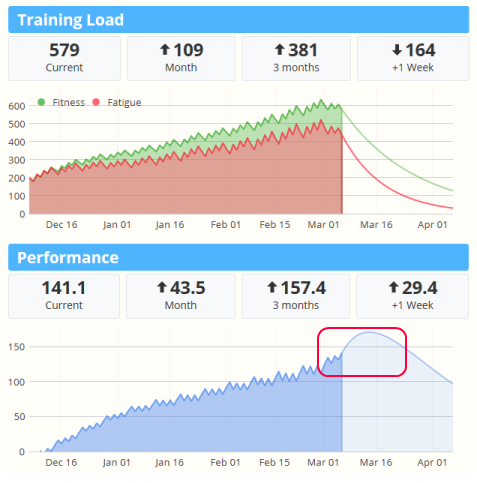
In the second example, we've chosen to simply take a week off before the race:
Using what you've learned, notice the difference of these charts in the last week versus the examples above. Compare the two tapers final predicted performance with the fitness and fatigue values.
Keep in mind the training load feature is a model which predicts performance. As with any model it is not 100% accurate so your peak taper timing may vary by a few days. If you look closely at the last two tapers you'll see variation in:
- Timing (the day the top of the curve peaks)
- Maximal predicted performance (the "height" of the top of the curve)
- Duration of peak (the "width" of the curve peak)
In the end, you still need to listen to your body (and your coach).
Any questions or comments on training load? Post below.
Comments
Hi.
Thanks for this it´s really nice.
But I think its a shame you have chosen to use / create the effort system instead of TSS.
It was the same then no problem.
But the effort systen tends to favorice time over intensity.
If I do all out bike intervals I get a lot of TSS during the X times 30 sek intervals, and only a few more during crusing before, between and after.
But the same ride will score low on the effort scale. Very low..
A longer ride with medium / intensity will score about equaly with both systems.
Then you can argue wich system is best.
But as far as I know a lot of things starts going on in the mucles when doing all out intervals. Wich wont be valued with the effort system.
Johnny
TSS is just a trademarked acronym that incorporates TRIMP[zone] for different data sources (HEARTRATE,SPEED,POWER). There isn't really any magic here, it's actually the same approach we use.
So, for a single workout, we -ABSOLUTELY- take into consideration time in zones. Your example with 30 seconds of high intensity should score higher during those phases, and lower during cruise phases.
Yep. This is how it should work, and this is how it does work.
For this to work, it's essential you do two things to make sure your data is categorized correctly:
1) Pick the right top-level category (run/bike)
2) Set up your POWER, HEARTRATE, SPEED zones on the training page for the particular category (under "My Account")
You may also be interested in the calculation details which talk about the order we rank data that is available:
http://www.sporttracks.mobi/blog/training-load-science-history-and-appli...
I'll save you a click, it's: 1) Heartrate, 2) Power, 3) Grade adjusted speed, 4) Speed, 5) Intensity.
Hi thanks for the reply.
That actualy explains it very well.
And it also explains the huge variations i see. When comparing to TSS based data.
Because i havent adjusted the heart rate zones since i dont care about zones when it comes to heartrate.
I train with a power meter so i have that date and thats where my focus is, and thats where i use zones.
So zones are set only in power and not in the rest of the options.
My oppinion is that it´s wront to use a calculation whit all that included when you have a power meter.
If you dont i think it very fine to get a value that does the same as TRIMP or TSS
TSS as i understand it is only based on the power zones taken from FTP.
So an option to choose the curent setup or a pure powerbased "TSS" would be absolutely fantastic.
Pretty much like the Training Load plugin in ST3.
But i like the look of the mobi vertion graph setup:)
Johnny
The blog post Aaron linked to shows, at least in its current version, that cycling effort is calculated based on power data (if available). I had the same concern as you, being a power meter user and knowing how much better power reflects the strain put on by a workout.
Nice and informative post, and a great addition to .mobi.
However, there are clear improvements I would like to see:
-Currently I can only see 1 month of fitness/fatigue/perf. of planned activities. This looks like not enough to plan a season or even a race. Ideally, we should be able to see impact of all planned workouts.
-Said before: Having hovering functions showing date, activities score and fitness/fatigue values (currently we have to guess/calculate fatigue value)would be nice.
Looking forward to the swimming improvements! ;)
Please feel free to request feature enhancements on our forum page here:
http://sporttracks.uservoice.com/forums/201951-general
Hi,
is this possible to translate the articles about Traing load to german language. I use the sport track and the mobi version also.
Thanks a lot
Peter
great explanation
So I found something interesting; all cycling activities of more than a hour in length have a (way) higher TE than a half marathon which i've ran last year.
To Clarify:
Running (HM) 21.1KM in 1.43.59 TE 90
Cycling 29.5KM in 1.08 TE 124
While the damage a HM does to my body and physical health is way higher (the way I feel it) than the cycling route.
I agree with koenbrinkerink, even with a correct setup of the zones i've got more effort point with cycling than running.
For sure the effort for my 1'29 half marathon was not the same as my 1'40 sunday bike ride but the effort score is quite the same...
I think you need to tweak a little bit more your effort calculations
Indeed. Though it might be an irregularity in the whole TE system, not just as it is applied in ST.
Definitely a model weakness. And this doesn't even get into aspects such as how a particular workout effects particular muscles (such as a hill workout), or cross training effects (doing 100 miles a week instead of 60 is not going to make you a better swimmer).
You can adjust the numbers generated by tweaking your zones, for example having more cycling zones so your "top" bike zone is typically coming in at 5/7th instead of 5/5th. Put a zone up top called "inhuman effort" or something :)
haha that seem a good option, will definitely add it to my cycling zones.
With Chart 1, would not the green fitness range start off at zero or near zero and gradually catch up the Fatigue line? And also since the Fatigue is a short term average and fitness a long term average of the same values it seems to me that the best that could happen in this scenario is that the two lines meet.
I noticed that in my own charts that the two values seem to move together too readily, Fatigue should decrease relatively quickly while Fitness decreases at about 1/6th of the rate.
Is that correct or am I misreading something?
The Banister model we use has default rates of 12 days for fatigue and 21 days for fitness. Currently these are hardcoded but the reality is it will vary by athlete, and even change as your conditioning changes.
So in an ideal world we would allow you to change these, but practically speaking it means you would have to work with an exercise scientist to dial in these numbers.
And there is even another coefficient you can tweak for percent effect of fatigue vs fitness!
I think the 1/6th rate you are referring to is the coefficients for the Training Stress Balance model, which uses a different decay model. Using the 7/42 from TSB would produce -really- weird charts in Banister.
Sorry to respond to such and old post, however I have just noticed that in the Training Options sections under Settings, I am now able to adjust the Fitness recovery, Fatigue recovery and the Fitness balance. Is there any available information on why you would adjust those values and how to best go about doing it?
Not at the moment, no. It's an advanced option for people with working knowledge of the Banister algorithm that might want to change it for different athletes they coach.
Well, one or two sentences describing this value would not harm. It would at least help to point to how this is described in the literature, esp. as Sporttracks uses a different terminology than the original TRIMP model.
I am trying to modify the training load parameters to better suit my historic performance since it does not reflect it correctly at the moment. I have looked into the banister original formula and the days for Fitness and Fatigue settings are pretty straight forward. However the fitness balance I am not sure of. I am guessing it its the balance between the k1 (positive weighting constant for fitness) and k2 (positive weighting constant for fatigue) factors in the formula but I am not sure what the percentage means. Could you give any input to this?
What are the default settings?
I have created another account just to answer the same question. The defaults are 49 days for fitness, 11 days for fatigue (looks like original Banister formula parameters https://fellrnr.com/wiki/Modeling_Human_Performance#The_Banister_Formula ) and balance of 40%
I´m using tyhe "original" Sportstrack 3.1 right now. Its very easy to manage my training through trainingload and fitplan. I like the look here, but not the possibilities to manage my training. Effort/fattigue looks nice as graphs but I miss a lot.
When I open trainingload in I have better graphs telling me more detailed, where I have to be a aware in my planning. I use my negative TSB to be in control. I use my CTL to see progress. I have all my workouts listet under the graphs. I make templates directly from existing workouts, so my planning is very close to reality. Very easy to manage. And all future workouts in a nice calendar with the numbers I have to follow for progress. In this system I can´t see how to control my training only by a red and green Graph and a effort-graph. I do not think you have me as a customer in one year. Sorry for you. A shame for me to pay 35 dollars for something I paid less for, whith greater options
I'm sorry to hear you're disappointed Henrik.
If you're used to the ST3 Training Load plugin which uses a different physiological model it will definitely take some getting used to the new data. I can see how you'd be uncomfortable switching. "Negative TSB" doesn't typically happen unless you stress your body really hard from an untrained state.
But the principles are the same. What you know as TSB is shown in the Performance chart. What you know as CTL is shown in the Fitness chart. (And ATL is Fatigue). The numbers won't match at all, but it's approximately similar. If your performance (TSB) crashes - you have a problem. If you're going into a race and your Fatigue (ATL) is close or matching your Fitness (CTL) - you have a problem. If you lay out a training plan with base building and your Performance isn't increasing - you have a problem.
Side note: We chose to go with the Banister model instead of TSB because it's more modern and has the most actual real world data validation. While TSB is familiar and comfortable to a lot because of the ST3 Training Load Plugin, we want to stay at the forefront of science.
SportTracks.mobi definitely supports planned workouts which you can add in the calendar just by clicking a day. You can enter your goals and it will calculate estimated effort. That effort is used in future Training Load.
So all these pieces and calculations are there - no question.
What is missing (I think I hear you?) - incorporating training load estimates into long term training plan building (a season) and show estimated effort over the entire plan WHILE you are building it, dynamically updating the charts.
Yes - this needs to be much better and smoother workflow. We totally agree. We have a lot of data and algorithm building blocks to put in place. We constantly look to improve user experience. And we hope to have a release update later this season to support these kinds of things (multi-week planning, import from excel, ical integration).
Thanks for the feedback.
I try to figure this new way to see things. I´m welltrained. When I manage my training 3 weeks ahead in ST3.1, yhen I hit a negative tsb between -11 and -15, before I every fourth week reduce my mileage with 20 % and only run by low heartrate this week. This way keep me from overtraining, and my ctl developes. I can follow TRIMP going down for comparable workouts. I have paid for a year so I wait and see comming improvements;-) I see what you answer, so I also see there are new way to use this site in the future. If its possible for you to see my trainingload, then I started to make a negative TSB app. 1. feb. I can see here, that I´m totally in control by theese for me new graphs. I´m in basebuilding, so not pushing very hard. But my TSB have been in minus 12 and you made some beautiful graphs for me here :-)) I now from experience when I have crashed. That I understood after start of using ST3. This I miss very mutch in this system is a number to follow, like I follow my TSB right now with succes. I can see its possible to make future plans here, and the try to find the most optimal way to make graphs and developement by the arrows up/down in top of the graphs
Thanks for taking time
I´ll try to spend some more time to understand this concept ;-)
Henrik
Hi
Thanks for this explanation, I've been trying to understand what the absolute numbers mean. For example my current training load is 1384 and my performance is 239.3 - should I be aiming to get my performance number up to a specific threshold for my main objective or are these just relative numbers which give an indication of my fitness trend.
Thanks and thanks for the stream of new stuff that just keeps on coming! I had my doubts about .mobi when you first released it and now I can't remember when I used 3.1 !!
Andrew
I still use 3.1 and just have a mobile platform here, where I can see, that the way I control my training in 3.1 with building up to a tsb at -15, I get the good graphs here you are talking about, if I have my every 4. week as a recovery week. When I go to the graph here, I cant get any numbers by dates, keeping the courser on the actually spot I´m interested in. I can´t yet make templates for future planning and put them in a calendar. I have to type all future exercises and in this system, it take me too long time compared to ST 3.1. Is there anyway in this mobisite to control the training forward, except the picture of the graphs?
Forgive me for this daft question, are ST3.1 and mobi different? i used the paid version of 3.1 and i keep getting emails about updates on mobi, is this an additional subscription?
I apologize if this comment is in the wrong "place" but every time I want to post it in the forums it logs me out and then I can't log in again. Anyways, the questions are about the fitness/fatigue and performance model. I was wondering if in the performance model the predictions for one week, one month and three month performance (added to the current) are based on continuing the same trend of workouts and hence the same efforts as the ones that were used for the calculations? My other question is what values should one be looking at while training for a marathon. In my case, my race is in exactly six and a half weeks and my values are: Current performance (238.5), One month (^57), Three months (^180.8) and one week (^55.3). Thanks.
I am also an old user of ST3 and the training load plugin - so I am also trying to understand the new model and see how it relates to the TSB model. First of all: negative TSB happens - also if you are well trained. I know my negative TSB number where I have pushed it to the limit, and most likely will get ill. I think the biggest challenge here is that people have been used to the TSB model to plan and predict, using either ST3 or some of your competitors software, and a lot of papers, tutorials, books uses that model. The 7/42 model can be configured in ST3 and it does not take a scientist, just you knowing your own body and a little experimenting. The 12/21 model seems a little strange from my perspective. Fatigue does roll off faster is my experience. Changing the zones is not the solution, since you use the zones for other part of the program, and would like to have the correct HR and PWR zones so you can see how much time you spend in each and so on. So HR and PWR zones only for the sake of calculating the the effort (which you would create with smaller intervals than your normal zones, I would expect) would be the best way to proceeded IMHO. But still, I do find many very nice features in the online version of SportTracks, and some overviews are better than in ST3, but there are still some years of programming ahead before I would skip the ST3 - if ever. With plugins, it is a far more professional analysis tool - but please keep up the good work. The online version is fairly new, and stuff is planned to be implemented, so it will get better. So for now they complement each other. The planing and follow up is done using Training load plugin and then I will try to see how it relates to the new model in Sporttracks. The last comment would be, please don't hide all the details (like configuration of 12/21), since advanced users would like as much configuration as possible to fit the tool to them and their body instead of fitting them and their body to the tool :-) But in general, I am positive about the tool and will continue to use it together with ST3.
Sorry, how do I access these charts? I looked all over my calendar and analysis, but cannot find it. Please, help! Thanks.
Pages