Spring is arriving here in North America, bringing with it race season and a number of useful updates to the SportTracks platform related to races and performance modeling.
Race Countdown
If you have a race planned, you may have noticed a new feature appeared on your dashboard showing a countdown timer to your next race:
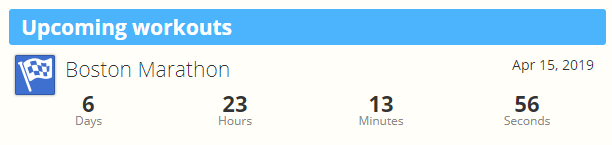
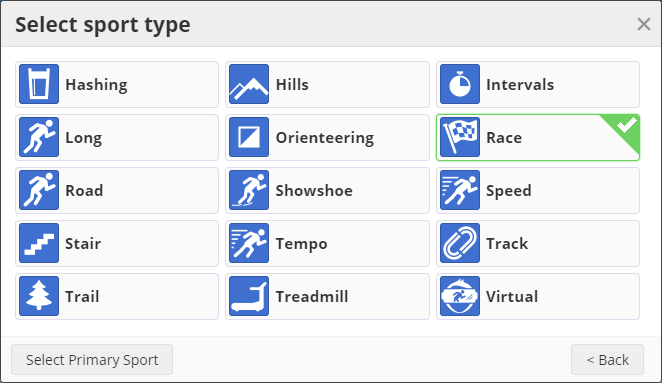
If you don't see a countdown timer to your next race, make sure to add the planned race to your calendar, and pick the "Race" type in the sub-sport for the run, ride or swim.
Health Chart Markers
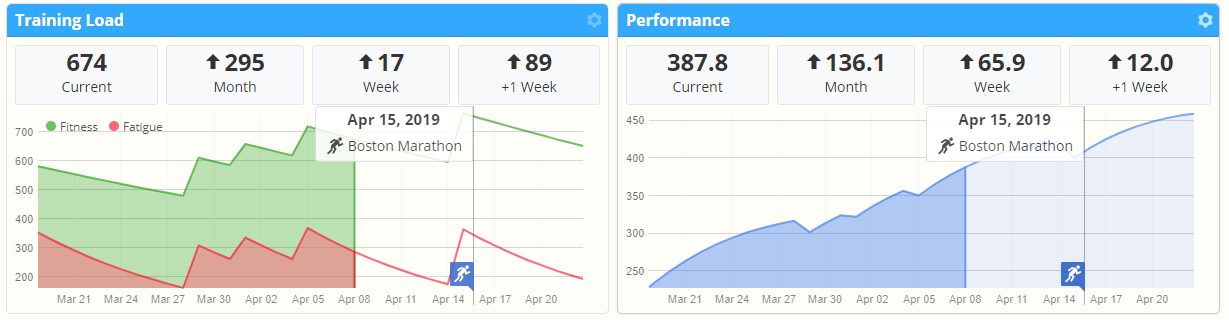
Over on the health page you can now add race markers to your charts. Our athletes requested to add this feature a while back and it makes a lot of sense. You can add race markers to any chart, but it probably makes the most sense on your performance charts. Moving your mouse over the marker shows the event details, and you can click it to zoom to the event:
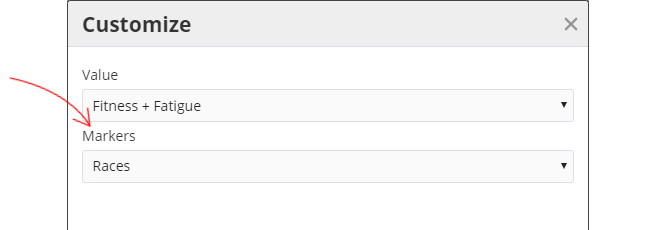
To add chart markers click the settings gear in the upper right corner of the chart panel and select the markers you want to see.
New Date Filters
You may have noticed another change on the health page - the time filter links have been replaced by a button that opens the date selection dialog. Using the dialog you can pick any range of custom dates, or a relative period of time before today. Relative dates can be any duration of time based on a number of days, weeks, months or years.
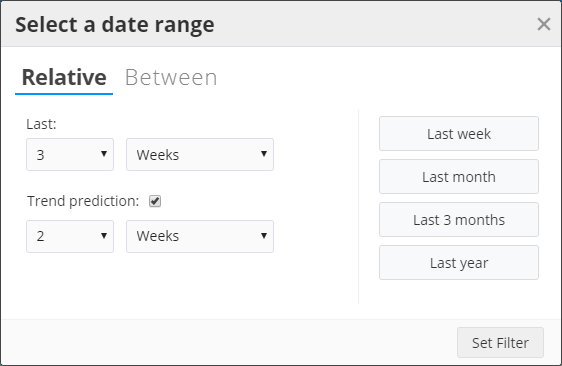
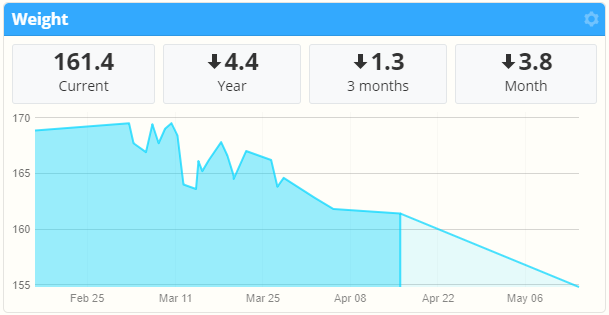
You can also totally customize a duration to show future predicted trends for performance modeling and health. Fitness, Fatigue and Performance will incorporate future planned workouts and changes due to recovery into your training load. Recorded health metrics you are tracking such as weight will use a straight line prediction from a best fit of the last 30 days of data. Use the trend prediction line with a grain of salt; there's no advanced modeling happening here, just a linear extrapolation on a best fit, so the line can get a bit nonsensical after a few weeks. But still, it's nice to see where things are going.
The date selection dialog is used in three other places: filtering the workouts in the analysis, workouts, and personal records pages. With this improvement you now have much more flexibility in customizing your reports to use relative dates. Enjoy!
Comments
Good stuff.
These are huge changes for me! These alone are worth the subs I've just paid for another year.
Great work.
Excellent! Now I can really zoom in on that ONE summer many years ago where I trained just right :)
But in all seriousness, good logical updates to the charting.
Good to see this! Keep the enhancements coming, please!
Absolutely great charts update... Thanks so much 👍
Very nice!
Great changes, started using the flexible dates rightaway, and I like the ability to hide projections (I don't plan workouts in Sporttracks, so it was just noise).
One bit of constructive feedback: Have the race countdown expressed in terms of weeks instead of saying something like "167 days", it should say "23 weeks 6 days". Most training plans are built around a number of weeks, making that the critical number to watch, not days. Just a suggestion. :-)
Thank you!
There is a pretty significant error in that new update. Current weight data is wrong with trend prediction turned off, while it's correct with it turned on.
Great with the flexible ranges! But I actually miss the buttons for an easy flip to long-term trends. Could one hope for a combination? Ie keep the excellent range selector but bring back some shortcut buttons as well?
I do not have race in by "select sport type" box