2019 Year In Review
The most interesting trends in endurance sports tech in 2019
Now that the finish line for 2019 is in sight, we thought it would be interesting to take a bird's eye view of our community to see if there were any noteworthy trends unfolding. Our little experiment ended up producing some pretty interesting results! We take privacy seriously at SportTracks, so all of the data was anonymized. Read on to find out what gear was trending and what made people faster in 2019.
NOTE: We initiated this project in November of 2019, so most of the dates are from November 2018 through October 2019.
Most Popular Running Shoes of 2019
Without question, the shoes that got the most attention in 2019 were the record-smashing Nike Vaporfly Next%. Eulid Kipchoge wore them when he ran his 1:59:40 marathon, Brigid Kosgei wore them when she crushed the women's fastest marathon record in Chicago, and they even helped a guy in a banana suit hang with the lead pack in the Toronto Half-Marathon.
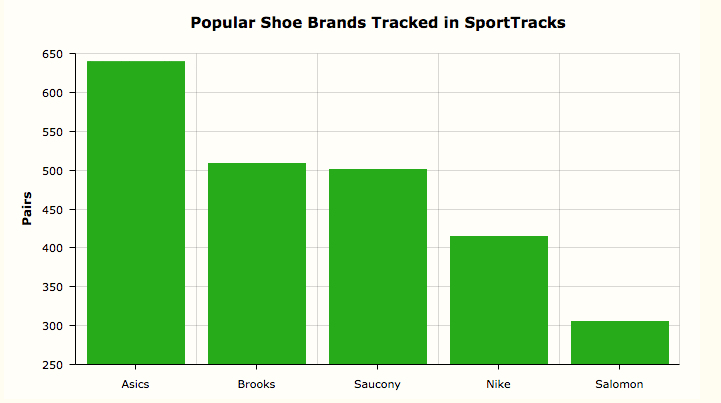
While it's clear that elite runners and high-speed bananas prefer these $250 USD Nikes, we were curious what most people wore in 2019. In our analysis of the advanced gear-tracking features in SportTracks, the top brand was Asics followed by Brooks and Saucony. Nike sat in a distant 4th:
One brand that didn't manage to crack the top 5 in the first chart made a stronger showing when it came to people tracking specific models of shoes. The following data isn't perfect, because some people don't enter shoe model names, and others give their shoes alternate names. But we figured you might be interested in the usable data we did have. The Saucony Kinvara 9 and the Altra Escalante tied for the most popular shoe model, and the Brooks Ghost 11 and Salomon Speedcross 4 tied for second. The Brooks Ghost 10 came in 5th:
Top 5 Running Shoe models
Saucony Kinvara 9
Altra Escalante
Brooks Ghost 11
Salomon Speedcross 4
Brooks Ghost 10
Use of Running Power Meters
Running power meters have only been commercially available for a few years, and we were curious if they were growing in popularity. Since they're so new, we decided to take a look at how much they've been adopted starting from the beginning of 2017. The data below is the percent of SportTracks users that ran with a power meter at least once a month:
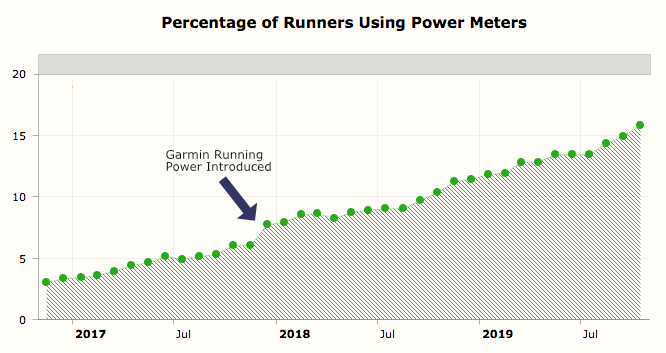
Run power usage clearly got a boost when Garmin introduced their running power app in December of 2017. This new running efficiency metric now comes included on the Polar Vantage V, and can be tracked on a large number of watches with the new Stryd footpod, which includes built-in wind detection. If you run with the new Stryd and a Garmin watch, your wind detection data (which Stryd calls Air Power) is pulled into SportTracks for analysis.
Out of curiosity, we decided to compare the performance of runners who used a power meter with those who didn't:
| No Power | Power Meter | Amount Faster | |
| Weekly Miles | 14.7 | 15.2 | |
| Avg Pace | 9:59/mi | 9:30/mi | |
| 5K | 10:11/mi | 9:49/mi | 1m 09s |
| 10K | 9:23/mi | 9:14/mi | 0m 56s |
| Marathon | 10:05/mi | 9:55/mi | 4m 22s |
One way to read these results is that the people who ran with power went further and faster. Does this mean that training and racing with power makes them more competitive? Or are the type of people who use running power meters more advanced athletes in general? There's no way to determine an answer, but the data is still compelling.
Total Workout Time in 2019
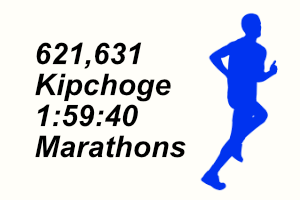
Instead of just blurting out the total amount of time that SportTracks users spent working out in 2019, we're going to make it more interesting: Eluid Kipchoge would need to run 621,631 marathons with 1:59:40 times, and a 30 minute 10K in order to match the amount of time SportTracks users worked out. Not too shabby!
Total Elevation Climbed in 2019
We're not going to tell you the number of times SportTracks users could have climbed Everest or made trips to the moon. Those analogies are a bit tired. In the spirit of keeping things interesting, we're going to learn about the Rüppell's griffon vulture! This is the highest flying bird on Earth. It can soar to an altitude of 37,000 feet (11,277.6 m). In 2019, SportTracks users ran, cycled, and hiked up to the altitude of the Rüppell's griffon vulture 15,036 times!

Total Distance Covered in 2019
If you're interested in sports tech, you likely often find yourself at DCRainmaker.com reading about gadgets. That blog started when its author, Ray Maker, lived in Washington DC. He later relocated to Paris, and currently lives in Amsterdam. If Ray were to swim, bike, and run his way back to DC (and oh what a swim it would be), he would travel 3,843 miles (6,185 k). In order to match the distance covered by SportTracks users in 2019, Ray would need to make this journey 2,385 times.

Total Swimming Distance in 2019
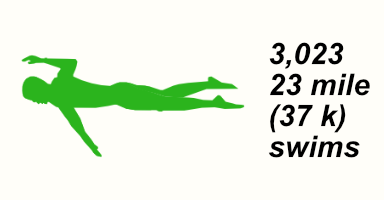
Swimmers love SportTracks for its industry-leading swim analysis tools, but what does the Loch Ness Monster think of it? For now, this remains a mystery. If you added up all of the swims tracked in SportTracks over the past 12 months, how many times could you swim the 23 mile (37 k) length of the Loch Ness? If you had a wetsuit that insulated you from the freezing waters, you would need to swim it 3,023 times.
Thanks for checking out this article! Hopefully you learned something about endurance sports trends in 2019, and a bit of trivia about a specific species of vulture.
| Article written by Sam Mallery, Director of Marketing, Zone Five Software Inc. |
Comments
Great little post!
You don't mention runscribe under the runner power - don't let Tim see this! :)
With regards to the pace/distance metrics of power users... I wonder what the graphs would look like if you separated Suunto and 'other'. Many Suunto users are the ultra types, so go further; but they probably wont give a hoot about power but get it for 'free'. What would be *even more* interesting would be if you were able to work out if a user has opted to even view the power graphs on Sporttracks (unlikely possible) ??
Power probably follows the same uptake curve as heart rate. Once oHR monitors were on the watch 'for free', you'd have seen the number of users logging HR shoot up... but doesn't mean any of those athletes are looking at it, or using it to improve their running.
Fun to look at the numbers though! :)
Agree, fun post. Given the trend in ultra races it would have been interesting to see how many of the users who do ultra running. And perhaps it could be seen that Suunto users are more likely to do more ultra running as you suggested. I do however disagree on Suunto users and power. I was for example running at the UTMB this year (a ultra race in the Alps), and I am both a Suunto and Stryd power user. I have many ultra friends who use power as a training/racing tool.
Not really sure on the "for free". Even if it is without cost (not completely on Garmin as you still need to buy a pod or special HRM. Polar does however on their top elite watch include free power) you would still need to download an app to measure power on Garmin. If its not working "out of the box" my guess would be that most don't use it.
My guess is that most users are Garmin (big majority) with Suunto, Polar and other brands having just a small user base. I am however one of those who would give "bad data" as I use both Suunto, Garmin and sometimes other brands,
When it comes to power graphs and analysis, Sporttracks unfortunately lacks behind big time. Most people I know, including myself, (must) use other solutions to analyse power data. Hopefully that is something Sporttracks will work on given the increase in use of power!
UTMB - big kudos for that!
I didnt really think that power would be useful for ultras - but maybe I am wrong. I've done up to 45 mile ultras (100k planned!), and with the variation in terrain, conditions, fatigue etc, it never occurred to me that power would be a useful metric.
So we pay yearly subscription for an "app" which is not even an app and our data are used to make statistics that must be sold away later on... I love it
Is it ever going to be possible to filter the analysis by active laps only? I don't really need to have my walking rest laps be figured into my total running distance or average running pace - or aerobic efficiency.
The data os already there, it's just not able to be used (forcing me to hold on to the desktop app)