We are introducing Training Load this week! This 3-part blog series highlighting Training Load begins with understanding the importance and usability of Training Load itself. When we showed this feature to our ambassador team the first response was overwhelmingly enthusiastic... immediately followed by a question:
"Okay... how does this all work?"
To better understand training load, there are two major concepts that must be covered:
Effort: Measuring the amount of effect a single workout has on your body.
Performance: Predicting performance changes over time from a series workouts.
Effort: TRIMP by any other name
Step 1 to predicting performance is calculating an effort for each workout. In concept effort is simple:
Effort = Intensity X Duration
In our system you can score 2 points per minute (120 per hour) at maximal effort. For example a 40 minute workout could score a maximum of 80 points. By simple math you can see how a short, high intensity workout (such as intervals) could score similar to a longer easy workout (such as a LSD run). Makes sense right?
Of course you're never going to be at maximal effort for an entire workout - this is where your GPS watch and other sensors come in:
We don't believe in obscure acronyms that require a scientist to understand...
- If you are a cyclist or runner and use a power meter, your effort is scored on power zones or FTP based on the effort basis option in your training settings.
- If you use a heart rate monitor, we score your effort based on your resting and maximum heart rate, and your zones.
- If you only have a GPS, your effort is scored on your speed/pace zones, adjusted for any hills you were running.
- For indoor endurance workouts or those without a GPS route, we score your effort on the average time in speed/pace zones.
- Finally if you're just doing a manual workout we use the value you've chosen for the perceived intensity of the workout.
If you're familiar with other software you may have heard something similar by various names: Training Stress Score (TSS), "Suffer Score", or TRIMP. We don't believe in obscure acronyms that require a scientist to understand so we've kept it easy to understand: effort. Besides, do you really want to keep seeing something that sounds like WIMP? I didn't think so.
We're also proud to say we use the most sophisticated algorithms on the market, and will handle any data scenarios you throw at us. We don't care if you're a triathlete swim-bike-running, if you're lifting weights, playing a game of volleyball, or finding your inner zen in a yoga class. You do it, we score it.
Performance: A three part story
After we've calculated all your effort scores for your entire workout history, Step 2 is to predict your fitness performance. Our performance model is based on the work Eric Banister started way back in 1975 and has been verified by dozens of studies.
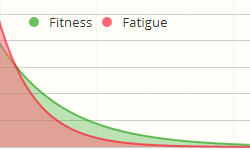
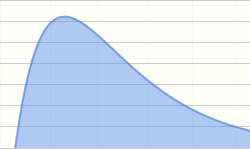
The model starts with an assumption that a workout has both a positive and negative effect. The positive effect is called "fitness" and the negative effect is called "fatigue". Fitness and fatigue are combined to provide "performance" - a prediction of how well you will do in an endurance event such as a race.
In the model both fatigue and fitness spike after a workout. Fatigue quickly drops off, while fitness drops off more slowly, creating a space of time where your fitness gains outweigh your fatigue, until both reach equilibrium again. This space represents your performance potential:
Performance = ( Fitness - Fatigue )
Illustrated by the two charts showing fitness, fatigue and performance:
To bring this back to the real world imagine your ideal pre-race taper.
You've been putting on serious miles all season long, so your fitness is high, but so is your fatigue. As you begin to taper, the long-term fitness gains remain, but your fatigue drops with the drop in workout effort. As a result, you see a performance peak that (ideally) happens 7-10 days after your taper starts.
And then... race day. And you kill it, just as the performance model predicted.
Taking it into the future
We've gone through calculating effort for your past workouts, shown how training load will track your fitness and fatigue, and shown how the models predict your performance for a few weeks into the future. But we've left out one final exciting feature - adding planned workouts to predict your seasonal and race performance months in advance.
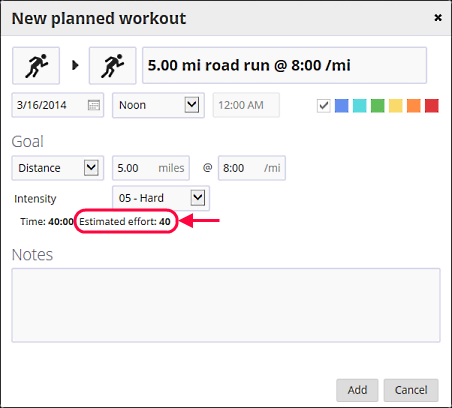
Using the same model of intensity and duration, it's possible to create planned workouts whose effort is estimated, and incorporate those numbers into your future training load. As your workouts are completed and your planned effort becomes actual effort the model refines goal to match reality. Pretty cool huh?
Create a planned workout and add your time or distance and pace, then set the intensity. You'll see effort calculated below, which will roll right into your future training load.
New to planned workouts? Check out our blog post Creating a training plan.
Coming up next...
For many people, the idea of using mathematical models to predict future performance is an entirely new concept and very exciting! If you're still a bit lost don't worry, we will help you along the path in the next few weeks with two more blog posts:
Comments
Effort calculated from HRM workouts will use resting/max heart rate to determine intensity. Runs without will use your running pace zones to determine intensity. You can review both of these to make sure the effort calculations across HRM /and non-HRM workouts are balanced.
Hi.
In Joe Friels/Coggans literature (for cycling with Power Meter, that is), they use Training Stress Score (TSS) for workouts and to estimate CTL (fitness) and ATL (fatigue). These numbers are usually around 50-100, at least for me. And their measurement of "performance" is Training Stress Balance = TSB = CTL - ATL. So a proper performance should land somewhere around +10/+20. I don't see how I can interpret the scalings of how sporttracks use fatigue, fitness and performance.
Usually, I plan workouts based on TSS, but I can't really predict my taper period. Is there a way to have CTL, ATL and TSB in these plots?
As an example, I have a workout from 23/5 that sporttracks "effort" says 77. But my TSS in trainerroad is 83. I recently updated all power zones to reflect my FTP in trainerroad.
SportTracks uses a different performance model so you can't directly compare the values from other software platforms.
Thanks for the quick response! Are there any plans to implement the power training theory developed by Coggan et. al. (i.e. CTL, ATL, TSS and TSB)? I don't know really, but their principles seem like a de facto standard in the cycling community. TSS should really not be any problem, since its basically (duration x NP x Intensity factor) / FTP. And CTL/ATL are only time filtered daily TSS (42 and 7 days filter, respectively). And TSB is only CTL - ATL. sounds simple! =)
Is it possible for the effort calculation to be wrong?
I did two runs over exactly the same course. Run A has an effort level of 32, Run B has an effort level of 23. However, Run A was slower and at a lower intensity, quite significantly, but has a higher score. I have looked at all the data for these sessions and cannot account for this 30% difference
Time, thats the difference
Hi,
Could you explain the major difference between your effort score and TSS and TRIMP? I get very different data here than from other analysis sites (which are near each other). Thanks.
I've starting recording my workouts on a Concept 2 indoor rower using ErgData, which gives me a record of power, pace, and heart rate throughout the workout. Does the effort calculation use the power track or does it treat it as an indoor endurance workout and score effort based on the average time in speed/pace zone?
where to keep Fatigue and Fitness ? what ration between them ? for now i have fitness 862 and fatigue 362.
i guess i could train much harder, right ? should i allow Fatigue to reach Fitness level sometimes? what's the best ratio between them (during a hard training, and after few days of rest)
Cool. Glad to see that such features are coming back. I'm using Suuntos Movescount for many years and over the arc of the last months they cut a lot of features from Movescount, including the abilities to analyze progress, rest etc.
Now I hope that your effort, fatigue and performance algorythms make it also into the Suunto App since they claim to work together with you. I that hope justified?
Cheers and THX
In my sporttracks records, I'm finding more Effort in cycling than running. It seems very strange for a Half Maraton in 1h: 40' a value of 88 compared to 1 hour of cycling just a little under FTP for 113.
Pages